In this tutorial, we will see examples of using the Chartjs JavaScript library to create bar charts.
This quick example gives you the code to display a simple bar chart on the browser.
The below JavaScript code shows how to include and initiate the ChartJS library. It uses static data to set the bar chart labels and dataset in JavaScript.
Quick example – Simple bar chart example via ChartJS
<!DOCTYPE html>
<html>
<head>
<title>Chart JS Bar Chart Example</title>
<link rel='stylesheet' href='style.css' type='text/css' />
</head>
<body> <div class="phppot-container"> <h1>Chart JS Bar Chart Example</h1> <div> <canvas id="bar-chart"></canvas> </div> </div> <script src="https://cdn.jsdelivr.net/npm/[email protected]/dist/chart.umd.min.js"></script> <script> // Bar chart new Chart(document.getElementById("bar-chart"), { type: 'bar', data: { labels: ["Elephant", "Horse", "Tiger", "Lion", "Jaguar"], datasets: [ { label: "Animals Count", backgroundColor: ["#51EAEA", "#FCDDB0", "#FF9D76", "#FB3569", "#82CD47"], data: [478, 267, 829, 1732, 1213] } ] }, options: { legend: { display: false }, title: { display: true, text: 'Chart JS Bar Chart Example' } } }); </script>
</body>
</html>
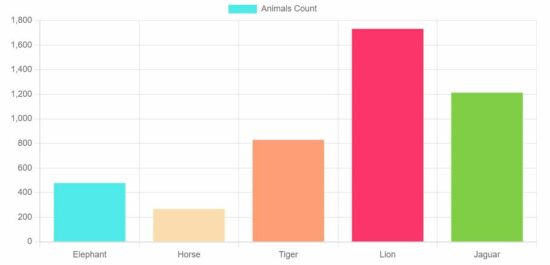
Output:
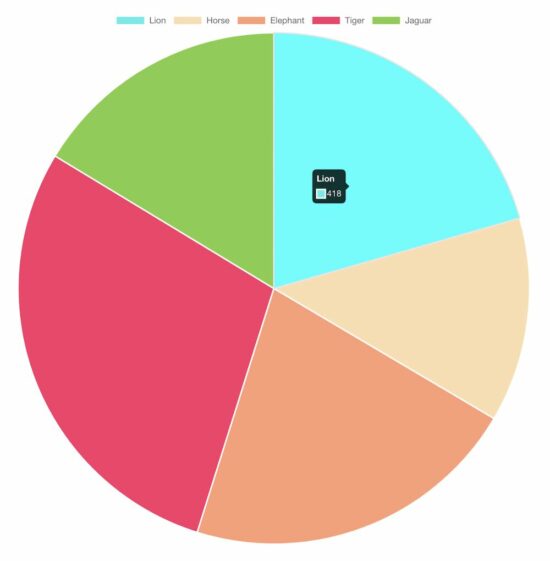
This example sets the chart parameters to the ChartJS data and the options array and displays the following bar chat to the browser.
This is a very easy client-side solution to display professional graphical representation in the form of a bar chart.
You can simply use this code in your project by tweaking the data points slightly.

Example 2: Horizontal bar chart
This library supports creating both vertical and horizontal bar charts. But, the default is the vertical bar chart.
In this example, it creates a horizontal bar chart using the ChartJS plugin.
For the vertical or horizontal bar charts, the direction depends on the indexAxis option.
This example sets indexAxis=’y’ to display the bars horizontally.
<!DOCTYPE html>
<html>
<head>
<title>Chart JS Horizontal Bar Chart Example</title>
<link rel='stylesheet' href='style.css' type='text/css' />
</head>
<body> <div class="phppot-container"> <h1>Chart JS Horizontal Bar Chart Example</h1> <div> <canvas id="horizontal-bar-chart"></canvas> </div> </div> <script src="https://cdn.jsdelivr.net/npm/[email protected]/dist/chart.umd.min.js"></script> <script> new Chart(document.getElementById("horizontal-bar-chart"), { type: 'bar', data: { labels: ["Elephant", "Horse", "Tiger", "Lion", "Jaguar"], datasets: [{ label: "Animals count", backgroundColor: ["#51EAEA", "#FCDDB0", "#FF9D76", "#FB3569", "#82CD47" ], data: [478, 267, 829, 1732, 1213] }] }, options: { indexAxis: 'y', legend: { display: false }, title: { display: true, text: 'Chart JS Horizontal Bar Chart Example' } } }); </script>
</body>
</html>
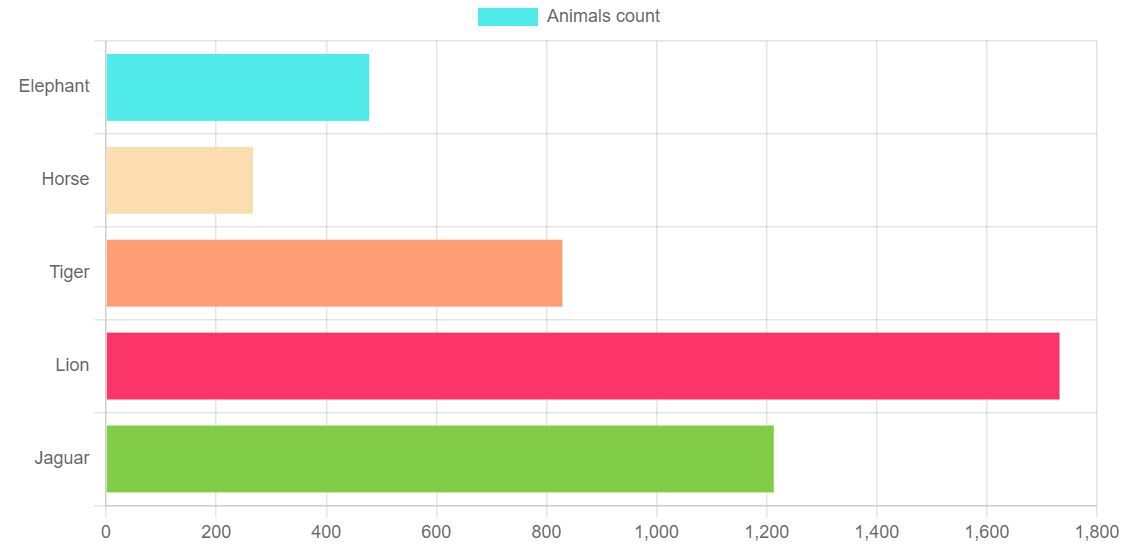
Output:
This output screenshot plots the bar chart data index on the ‘y’ axis and has the readings on the ‘x-axis.
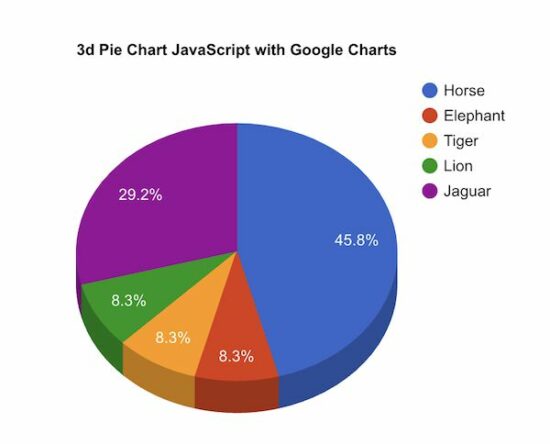
Previously, we used this JS library to create a pie chart using this ChartJS library. But, it is not supporting to display of 3D pie charts. See the linked article that uses Google charts for creating the 3D pie chart.
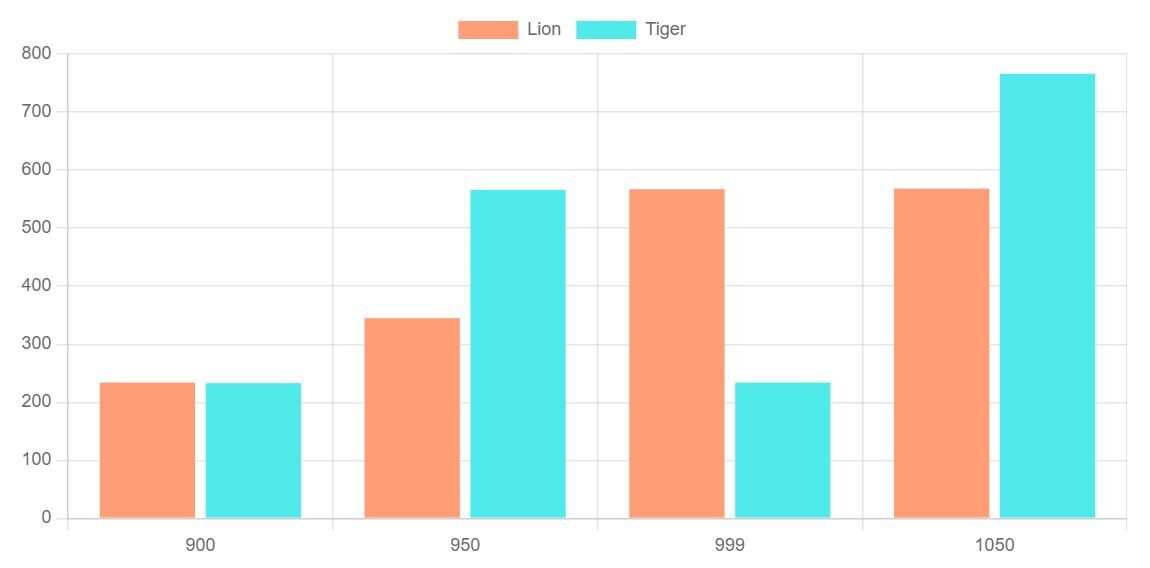
Example 3: Grouped bar chart
Grouped bar charts are useful for showing a comparative reading.
<!DOCTYPE html>
<html>
<head>
<title>Chart JS Grouped Bar Chart Example</title>
<link rel='stylesheet' href='style.css' type='text/css' />
</head>
<body> <div class="phppot-container"> <h1>Chart JS Grouped Bar Chart Example</h1> <div> <canvas id="bar-chart"></canvas> </div> </div> <script src="https://cdn.jsdelivr.net/npm/[email protected]/dist/chart.umd.min.js"></script> <script> new Chart(document.getElementById("bar-chart"), { type: 'bar', data: { labels: ["900", "950", "999", "1050"], datasets: [{ label: "Lion", backgroundColor: "#FF9D76", data: [234, 345, 567, 568] }, { label: "Tiger", backgroundColor: "#51EAEA", data: [233, 566, 234, 766] }] }, options: { legend: { display: false }, title: { display: true, text: 'Chart JS Grouped Bar Chart Example' } } }); </script>
</body>
</html>
Output:
It displays the record of two animals’ counts at a particular point. This will help compare the readings of two or more indexes.
ChartJS type parameter
ChartJS is a dependable JS library to create and display graphs on a webpage.
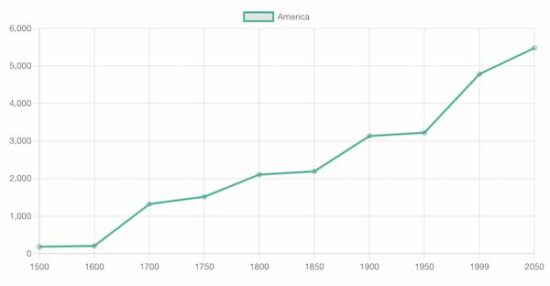
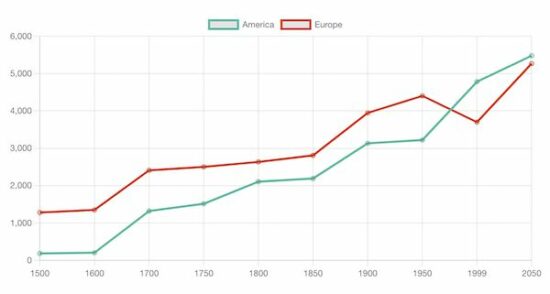
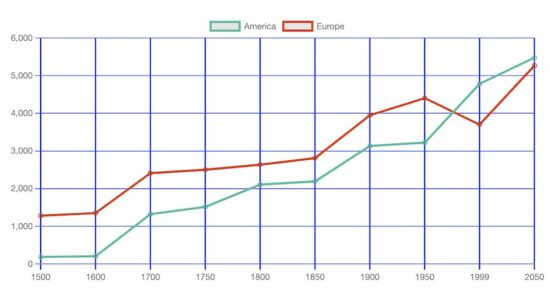
In a previous tutorial, we have seen how to create a line chart using this ChartJS library.
Also, it supports generating more types of charts. The type parameter is used to define the type of the chart.
The dataset and the options definition may vary based on the type of chart.
Download