Fedora is heading back to sunny Southern California! As we gear up for SCaLE 23x, we are thrilled to announce a special edition of Fedora Hatch. This is taking place on Friday, March 6 as an embedded track at SCALE.
Whether you’re a long-time contributor, a curious user, or someone looking to make your very first pull request, Fedora Hatch is designed for you. This is our way of bringing the experience of Flock (our annual contributor conference) to a local level. It focuses on connection, collaboration, and community growth.
What’s Happening?
This year, Fedora has secured a dedicated track on Friday at SCALE. We’ve curated a line-up that balances technical deep dives with essential community initiatives.
When: Friday, March 6, 2026
Where: Room 208, Pasadena Convention Center
Who: You! (And a bunch of friendly Fedorans)
The Schedule Highlights
We have a packed morning featuring five talks and a hands-on workshop:
Getting Started in Open Source and Fedora (Amy Marrich): Are you new to the world of open source? Or are you looking to make your first contribution? This session will provide a guide for beginners interested in contributing to open source projects. It will focus on the Fedora project. We’ll cover a variety of topics, like finding suitable projects, making your first pull request, and navigating community interactions. Attendees will leave with practical tips, resources, and the confidence to embark on their open source journey.
Fedora Docs Revamp Initiative (Shaun McCance): The Fedora Council recently approved an initiative to revamp the Fedora docs. The initiative aims to establish a support team to maintain a productive environment for writing docs. It will establish subteams with subject matter expertise to develop docs in specific areas of interest. We’ll describe some of the challenges the Fedora docs have faced, and present the progress so far in improving the docs. You’ll also learn how you can help Fedora have better docs.
A Brief Tour of the Age of Atomic (Laura Santamaria): Ever wished to try a number of different desktop experiences quickly in your homelab? Maybe it’s time to explore Fedora Atomic or Universal Blue! The tour starts with what makes these experiences special. It will then review the options including Silverblue, Cosmic, Bluefin and Bazzite (yes, the gaming OS). We’ll briefly get under the hood to explore bootc, the technology powering Atomic. Finally, we’ll explore how you can contribute to the future of Fedora Atomic.
Accelerating CentOS with Fedora (Davide Cavalca): This talk will explore how CentOS SIGs are able to leverage the work happening in Fedora to improve the quality and velocity of packages in CentOS Stream. We’ll cover how the CentOS Hyperscale SIG is able to deliver faster-moving updates for select packages, and how the CentOS Proposed Updates SIG integrates bugfixes and improves the contribution process to the distribution.
Agentic Workloads on Linux: Btrfs + Service Accounts Architecture (David Duncan): As AI agents become more prevalent in enterprise environments, Linux systems need architectural patterns that provide isolation, security, and efficient resource management. This session explores an approach, using BTRFS subvolumes combined with dedicated service accounts, to build secure, isolated environments for autonomous AI agents in enterprise deployment.
RPM Packaging Workshop (Carl George): While universal package formats like Flatpak, Snap, and AppImage have gained popularity for their cross-distro support, native system packages remain a cornerstone of Linux distributions. These native formats offer numerous benefits. Understanding them is essential for those who want to contribute to the Linux ecosystem at a deeper level. In this hands-on workshop, we’ll explore RPM, the native package format used by Fedora, CentOS, and RHEL. RPM is a powerful and flexible tool. It plays a vital role in the management and distribution of software for these operating systems.
Don’t forget to swing by the Fedora Booth in the Expo Hall! Our team will be there all weekend (March 6–8) with live demonstrations of Fedora Linux 43, GNOME 49 improvements, and plenty of fresh swag to go around.
Registration Details
To join us at the Hatch, you’ll need a SCaLE 23x pass.
Location: Pasadena Convention Center, 300 E Green St, Pasadena, CA.
The Podman team and the Fedora Quality Assurance team are organizing a Test Week from Friday, February 27 through Friday, March 6, 2026. This is your chance to get an early look at the latest improvements coming to Podman and see how they perform on your machine.
What is Podman?
For those new to the tool, Podman is a daemonless, Linux-native engine for running, building, and sharing OCI containers. It offers a familiar command-line experience but runs containers safely without requiring a root daemon.
What’s Coming in Podman 5.8?
The upcoming release includes updates designed to make Podman faster and more robust. Here is what you can look forward to, and what you can try out during this Fedora Test Day.
A Modern Database Backend (SQLite)
Podman is upgrading its internal storage logic by transitioning to SQLite. This change modernizes how Podman handles data under the hood, aiming for better stability and long-term robustness.
Faster Parallel Pulls
This release brings optimizations to how Podman downloads image layers, specifically when pulling multiple images at the same time. For a deep dive into the engineering behind this, check out the developer blog post on Accelerating Parallel Layer Creation.
Experiment and Explore: Feel free to push the system a bit and try pulling several large images simultaneously to see if you notice the performance boost. Beyond that, please bring your own workflows. Don’t just follow the wiki instructions. Run the containers and commands you use daily. Your specific use cases are the best way to uncover edge cases that standard tests might miss.
Mrhbaan, Fedora community! I am happy to share that as of 10 February 2026, Fedora is now available in Syria. Last week, the Fedora Infrastructure Team lifted the IP range block on IP addresses in Syria. This action restores download access to Fedora Linux deliverables, such as ISOs. It also restores access from Syria to Fedora Linux RPM repositories, the Fedora Account System, and Fedora build systems. Users can now access the various applications and services that make up the Fedora Project. This change follows a recent update to the Fedora Export Control Policy. Today, anyone connecting to the public Internet from Syria should once again be able to access Fedora.
This article explains why this is happening now. It also covers the work behind the scenes to make this change happen.
Why Syria, why now?
You might wonder: what happened? Why is this happening now? I cannot answer everything in this post. However, the story begins in December 2024 with the fall of the Assad regime in Syria. A new government took control of the country. This began a new era of foreign policy in Syrian international relations.
This may seem like a small change. Yet, it is significant for Syrians. Some U.S. Commerce Department regulations remain in place. However, the U.S. Department of the Treasury’s policy change now allows open source software availability in Syria. The Fedora Project updated its stance to welcome Syrians back into the Fedora community. This matches actions taken by other major platforms for open source software, such as Microsoft’s GitHub.
Syria & Fedora, behind the scenes
Opening the firewall to Syria took seconds. However, months of conversations and hidden work occurred behind the scenes to make this happen. The story begins with a ticket. Zaid Ballour (@devzaid) opened Ticket #541 to the Fedora Council on 1 September 2025. This escalated the issue to the Fedora Council. It prompted a closer look at the changing political situation in Syria.
Jef Spaleta and I dug deeper into the issue. We wanted to understand the overall context. The United States repealed the 2019 Caesar Act sanctions in December 2025. This indicated that the Fedora Export Policy Control might be outdated.
During this time, Jef and I spoke with legal experts at Red Hat and IBM. We reviewed the situation in Syria. This review process took time. We had to ensure compliance with all United States federal laws and sanctions. The situation for Fedora differs from other open source communities. Much of our development happens within infrastructure that we control. Additionally, Linux serves as digital infrastructure. This context differs from a random open source library on GitHub.
However, the path forward became clear after the repeal of the 2019 Caesar Act. After several months, we received approval. Fedora is accessible to Syrians once again.
We wanted to share this exciting announcement now. It aligns with our commitment to the Fedora Project vision:
“The Fedora Project envisions a world where everyone benefits from free and open source software built by inclusive, welcoming, and open-minded communities.“
We look forward to welcoming Syrians back into the Fedora community and the wider open source community at large. Mrhbaan!
If you followed along with my blog, you’d have a chatbot running on your local Fedora machine. (And if not, no worries as the scripts below implement this chatbot!) Our chatbot talks, and has a refined personality, but does it know anything about the topics we’re interested in? Unless it has been trained on those topics, the answer is “no”.
I think it would be great if our chatbot could answer questions about Fedora. I’d like to give it access to all of the Fedora documentation.
How does an AI know things it wasn’t trained on?
A powerful and popular technique to give a body of knowledge to an AI is known as RAG, Retrieval Augmented Generation. It works like this:
If you just ask an AI “what color is my ball?” it will hallucinate an answer. But instead if you say “I have a green box with a red ball in it. What color is my ball?” it will answer that your ball is red. RAG is about using a system external to the LLM to insert that “I have a green box with a red ball in it” part into the question you are asking the LLM. We do this with a special database of knowledge that takes a prompt like “what color is my ball?”, and finds records that match that query. If the database contains a document with the text “I have a green box with a red ball in it”, it will return that text, which can then be included along with your original question. This technique is called RAG, Retrieval Augmented Generation.
ex:
“What color is my ball?”
“Your ball is the color of a sunny day, perhaps yellow? Does that sound right to you?”
“I have a green box with a red ball in it. What color is my ball?”
“Your ball is red. Would you like to know more about it?”
The question we’ll ask for this demonstration is “What is the recommended tool for upgrading between major releases on Fedora Silverblue”
The answer I’d be looking for is “ostree”, but when I ask this of our chatbot now, I get answers like:
Red Hat Subscription Manager (RHSM) is recommended for managing subscriptions and upgrades between major Fedora releases.
You can use the Fedora Silver Blue Upgrade Tool for a smooth transition between major releases.
You can use the `dnf distro-sync` command to upgrade between major releases in Fedora Silver Blue. This command compares your installed packages to the latest packages from the Fedora Silver Blue repository and updates them as needed.
These answers are all very wrong, and spoken with great confidence. Here’s hoping our RAG upgrade fixes this!
Docs2DB – An open source tool for RAG
We are going to use the Docs2DB RAG database application to give our AI knowledge. (note, I am the creator of Docs2DB!)
A RAG tool consists of three main parts. There is the part that creates the database, ingesting the source data that the database holds. There is the database itself, it holds the data. And there is the part that queries the database, finding the text that is relevant to the query at hand. Docs2DB addresses all of these needs.
Gathering source data
This section describes how to use Docs2DB to build a RAG database from Fedora Documentation. If you would like to skip this section and just download a pre-built database, here is how you do it:
If you do download the pre-made database then skip ahead to the next section.
Now we are going to see how to make a RAG database from source documentation. Note that the pre-built database, downloaded in the curl command above, uses all of the Fedora documentation, whereas in this example we only ingest the “quick docs” portion. FedoraDocsRag, from github, is the project that builds the complete database.
To populate its database, Docs2DB ingests a folder of documents. Let’s get that folder together.
There are about twenty different Fedora document repositories, but we will only be using the “quick docs” for this demo. Get the repo:
Fedora docs are written in AsciiDoc. Docs2DB can’t read AcsciiDoc, but it can read HTML. (The convert.sh script is available at the end of this article). Just copy the convert.sh script into the quick-docs repo and run it and it makes an adjacent quick-docs-html folder.
sudo dnf install podman podman-compose
cd quick-docs
curl -LO https://gist.githubusercontent.com/Lifto/73d3cf4bfc22ac4d9e493ac44fe97402/raw/convert.sh
chmod +x convert.sh
./convert.sh
cd ..
Now let’s ingest the folder with Docs2DB. The common way to use Docs2DB is to install it from PyPi and use it as a command line tool.
A word about uv
For this demo we’re going to use uv for our Python environment. The use of uv has been catching on, but because not everybody I know has heard of it, I want to introduce it. Think of uv as a replacement for venv and pip. When you use venv you first create a new virtual environment. Then, and on subsequent uses, you “activate” that virtual environment so that magically, when you call Python, you get the Python that is installed in the virtual environment you activated and not the system Python. The difference with uv is that you call uv explicitly each time. There is no “magic”. We use uv here in a way that uses a temporary environment for each invocation.
Install uv and Podman on your system:
sudo dnf install -y uv podman podman-compose
# These examples require the more robust Python 3.12
uv python install 3.12
# This will run Docs2DB without making a permanent installation on your system
uvx --python 3.12 docs2db ingest quick-docs-html/
Only if you are curious! What Docs2DB is doing
If you are curious, you may note that Docs2DB made a docs2db_content folder. In there you will find json files of the ingested source documents. To build the database, Docs2DB ingests the source data using Docling, which generates json files from the text it reads in. The files are then “chunked” into the small pieces that can be inserted into an LLM prompt. The chunks then have “embeddings” calculated for them so that during the query phase the chunks can be looked up by “semantic similarity” (e.g.: “computer”, “laptop” and “cloud instance” can all map to a related concept even if their exact words don’t match). Finally, the chunks and embeddings are loaded into the database.
Build the database
The following commands complete the database build process:
uv tool run --python 3.12 docs2db chunk --skip-context
uv tool run --python 3.12 docs2db embed
uv tool run --python 3.12 docs2db db-start
uv tool run --python 3.12 docs2db load
Now let’s do a test query and see what we get back
uvx --python 3.12 docs2db-api query "What is the recommended tool for upgrading between major releases on Fedora Silverblue" --format text --max-chars 2000 --no-refine
On my terminal I see several chunks of text, separated by lines of —. One of those chunks says:
“Silverblue can be upgraded between major versions using the ostree command.”
Note that this is not an answer to our question yet! This is just a quote from the Fedora docs. And this is precisely the sort of quote we want to supply to the LLM so that it can answer our question. Recall the example above about “I have green box with a red ball in it”? The statement the RAG engine found about ostree is the equivalent for this question about upgrading Fedora Silverblue. We must now pass it on to the LLM so the LLM can use it to answer our question.
Hooking it in: Connecting the RAG database to the AI
Later in this article you’ll find talk.sh. talk.sh is our local, open source, LLM-based verbally communicating AI; and it is just a bash script. To run it yourself you need to install a few components, this blog walks you through the whole process. The talk.sh script gets voice input, turns that into text, splices that text into a prompt which is then sent to the LLM, and finally speaks back the response.
To plug the RAG results into the LLM we edit the prompt. Look at step 3 in talk.sh and you see we are injecting the RAG results using the variable $CONTEXT. This way when we ask the LLM a question, it will respond to a prompt that basically says “You are a helper. The Fedora Docs says ostree is how you upgrade Fedora Silverblue. Answer this question: How do you upgrade Fedora Silverblue?”
“What is the recommended tool for upgrading between major releases on Fedora Silverblue”
And we get:
“Ostree command is recommended for upgrading Fedora Silver Blue between major releases. Do you need guidance on using it?”
Sounds good to me!
Knowing things
Our AI can now know the knowledge contained in documents. This particular technique, RAG (Retrieval Augmented Generation), adds relevant data from an ingested source to a prompt before sending that prompt to the LLM. The result of this is that the LLM generates its response in consideration of this data.
Try it yourself! Ingest a library of documents and have your AI answer questions with its new found knowledge!
AI Attribution: The convert.sh and talk.sh scripts in this article were written by ChatGPT 5.2 under my direction and review. The featured image was generated using Google Gemini.
convert.sh
OUT_DIR="$PWD/../quick-docs-html"
mkdir -p "$OUT_DIR" podman run --rm \ -v "$PWD:/work:Z" \ -v "$OUT_DIR:/out:Z" \ -w /work \ docker.io/asciidoctor/docker-asciidoctor \ bash -lc ' set -u ok=0 fail=0 while IFS= read -r -d "" f; do rel="${f#./}" out="/out/${rel%.adoc}.html" mkdir -p "$(dirname "$out")" echo "Converting: $rel" if asciidoctor -o "$out" "$rel"; then ok=$((ok+1)) else echo "FAILED: $rel" >&2 fail=$((fail+1)) fi done < <(find modules -type f -path "*/pages/*.adoc" -print0) echo echo "Done. OK=$ok FAIL=$fail" '
talk.sh
#!/usr/bin/env bash set -e # Path to audio input
AUDIO=input.wav # Step 1: Record from mic
echo " Speak now..."
arecord -f S16_LE -r 16000 -d 5 -q "$AUDIO" # Step 2: Transcribe using whisper.cpp
TRANSCRIPT=$(./whisper.cpp/build/bin/whisper-cli \ -m ./whisper.cpp/models/ggml-base.en.bin \ -f "$AUDIO" \ | grep '^\[' \ | sed -E 's/^\[[^]]+\][[:space:]]*//' \ | tr -d '\n')
echo " $TRANSCRIPT" # Step 3: Get relevant context from RAG database
echo " Searching documentation..."
CONTEXT=$(uv tool run --python 3.12 docs2db-api query "$TRANSCRIPT" \ --format text \ --max-chars 2000 \ --no-refine \ 2>/dev/null || echo "") if [ -n "$CONTEXT" ]; then echo " Found relevant documentation:" echo "- - - - - - - - - - - - - - - - - - - - - - - - - - - - - - - - - - - - - - - - -" echo "$CONTEXT" echo "- - - - - - - - - - - - - - - - - - - - - - - - - - - - - - - - - - - - - - - - -"
else echo " No relevant documentation found"
fi # Step 4: Build prompt with RAG context
PROMPT="You are Brim, a steadfast butler-like advisor created by Ellis. Your pronouns are they/them. You are deeply caring, supportive, and empathetic, but never effusive. You speak in a calm, friendly, casual tone suitable for text-to-speech. Rules: - Reply with only ONE short message directly to Ellis. - Do not write any dialogue labels (User:, Assistant:, Q:, A:), or invent more turns.
- ≤100 words.
- If the documentation below is relevant, use it to inform your answer.
- End with a gentle question, then write <eor> and stop.
Relevant Fedora Documentation:
$CONTEXT
User: $TRANSCRIPT
Assistant:" # Step 5: Get LLM response using llama.cpp
RESPONSE=$( LLAMA_LOG_VERBOSITY=1 ./llama.cpp/build/bin/llama-completion \ -m ./llama.cpp/models/microsoft_Phi-4-mini-instruct-Q4_K_M.gguf \ -p "$PROMPT" \ -n 150 \ -c 4096 \ -no-cnv \ -r "<eor>" \ --simple-io \ --color off \ --no-display-prompt
) # Step 6: Clean up response
RESPONSE_CLEAN=$(echo "$RESPONSE" | sed -E 's/<eor>.*//I')
RESPONSE_CLEAN=$(echo "$RESPONSE_CLEAN" | sed -E 's/^[[:space:]]*Assistant:[[:space:]]*//I') echo ""
echo " $RESPONSE_CLEAN" # Step 7: Speak the response
echo "$RESPONSE_CLEAN" | espeak
Anaconda installer now supports installation of bootc based bootable container images using the new bootc command. It has supported several types of payload to populate the root file system during installation. These include RPM packages (likely the most widely used option), tarball images you may know from Fedora Workstation, ostree, and rpm-ostree containers. The newest addition to the family, from a couple of weeks ago, is bootc-based bootable containers.
The difference is under the hood
We have added a new bootc kickstart command to Anaconda to support the new feature. This is very similar to the ostreecontainer command that has been present for some time. From the user’s perspective the two are very similar. The main difference, however, is under the hood.
One of the most important setup steps for a deployment is to create a requested partitioning in both cases. When the partitioning is ready, the ostreecontainer command makes Anaconda deploy the image onto the root filesystem using the ostree tool. It also executes the bootupctl tool to install and set up the bootloader. By contrast, with bootc containers installed using the bootc kickstart command, both the filesystem population and bootloader configuration is performed via the bootc tool. This makes the deployment process even more integrated.
The content of the container images used for installation is another difference. The bootc-enabled images are somewhat more versatile. Apart from installation using Anaconda, they provide a self-installing option via the bootc command executed from within a running container.
On the other hand, both options provide you with a way to install an immutable system based on a container image. This option may be useful for particular use cases where regular installation from RPM packages is not desired. This might be due to potentially lower deployment speed or inherent mutability of the resulting system.
A simple how-to
In practice, you’d likely use a custom container with pre-configured services, user accounts and other configuration bits and pieces. However, if you want to quickly try out how the new Anaconda’s feature works, you just need to follow a few simple steps. Starting with a Fedora Rawhide ISO:
First, take an existing container from a registry and create a minimal kickstart file instructing Anaconda to install the bootable container image:
# Beware that this kickstart file will wipe out the existing disk partitions.
# Use it only in an experimental/isolated environment or edit it accordingly!
zerombr
clearpart --all --initlabel
autopart lang en_US.UTF-8
keyboard us timezone America/New_York --utc
rootpw changeme bootc --source-imgref=registry:quay.io/fedora/fedora-bootc:rawhide
As a next step, place the kickstart file in some reachable location (e. g. HTTP server), point Anaconda to it by appending the following on the kernel command line:
inst.ks=http://url/to/kickstart
Now start the installation.
Alternatively, you may use the mkksiso tool provided by the lorax package to embed the kickstart file into the installation ISO.
When installation and reboot is complete, you are presented with an immutable Fedora Rawhide system. It will be running on your hardware (or VM) installed from a bootable container image.
Is there anything more about bootc in Anaconda?
You may ask if this option is limited to Fedora Rawhide container images. Technically speaking, you can use the Fedora Rawhide installation ISO to install, for instance, a CentOS Stream container image:
Nevertheless, keep in mind that for now Anaconda will handle it as Fedora installation in such a case. This is because it runs from a Fedora Rawhide boot ISO. This may result in unforeseen problems, such as getting a btrfs-based partitioning that CentOS Stream won’t be able to boot from. This particular issue is easily overcome by explicitly telling Anaconda to use some different partitioning type, e. g. autopart –fstype=xfs. We would like to address the lack of container images handling based on the contained operating system or flavour in the future. For now, one just needs to take the current behavior into consideration when using the bootc command.
There are a couple more known limitations in Anaconda or bootc at this point in time. These include lack of support for partitioning setups spanning multiple disks, support for arbitrary mount points, or for installation from authenticated registries. But we hope it won’t take long to solve those shortcomings. There are also plans to make the new bootc command available even on the RHEL-10 platform.
We invite you to try out this new feature and share your experience, ideas or comments with the Installer team. We are looking forward to hearing from you in a thread on discussion.fedoraproject.org!
The core motivation behind data analysis pipelines, and the focus of this article, is the need to establish a clear path from unprocessed data to actionable insights for contributor engagement and impact. The key question is “what are we trying to measure to ensure the continuity of community work?”
As a side note, my preparation for the ADSP (Advanced Data Analysis Semi-Professional) certification in Korea utilized RStudio Desktop, running on a Fedora Linux environment. I got hands-on with R’s core statistical toolkit, leveraging base functions. Among these were summary()1 and lm()2 as the basis for fundamental hypothesis testing and regression analysis3. I became more intrigued by R’s power after testing its data manipulation packages (especially the key package dplyr).
With this background in mind, the article focuses on the design of an analysis pipeline that fulfills three objectives:
it ensures scalable data transformation and analysis capabilities
Establishing such a robust foundation is essential for producing reliable and validated metrics for the contributor community, which itself is subject to ongoing definition and validation.
Acknowledgement: I extend my sincere gratitude to Justin Wheeler for connecting me with the Fedora Data Working Group (FDWG), and to Michael Winters and K Naraian for their guidance, discussion, and support throughout the design and validation of this data analysis pipeline.
Scope and Tool Selection: Please note that this analysis pipeline represents a combination of tools and methods chosen from my perspective as a data analyst, particularly one with a background in the CRM (Customer Relationship Management) domain and consumer electronics industry. Therefore, other analysts or data engineers may utilize different combinations of technologies based on their own expertise or project requirements.
The role of the analyst is undergoing a fundamental transformation in 2025. We are moving beyond the traditional responsibility of performing statistical analysis and presenting visualization on pre-cleaned data. Today, the modern analyst must evolve into a “Data Ops(Operations)”. This requires a holistic understanding of the data lifecycle and bridging the gap between business context and data engineering. This expansion mandates a familiarity with ELT/ETL processes to examine the quality and structure of the data source.
Moreover, data analysts must be adept at processing diverse data types such as semi-structured data (for example, schema-less JSON strings or variant) and understanding various data access methods such as leveraging the efficiency of in-situ processing over the constraints of in-memory loading of datasets.
RStudio: The Unified IDE for Hybrid R and Python workflows
My ADSP examination requirements motivated my initial deep dive into RStudio. However, it is worth highlighting its utility as a tool for any data professional. The most significant benefit of using RStudio is its seamless ability to leverage the best tools from both the R and Python language ecosystems. This eliminates the need for the analyst to switch environments which leads to dramatically higher operational efficiency. This unified approach streamlines the analysis lifecycle from code execution to final reporting.
Python for data engineering
Use Python’s libraries like Pandas for efficient ETL/ELT operations, data manipulation on large datasets, and integrating with production environments or machine learning workflows (TensorFlow/PyTorch).
R for analysis and visualization
Utilize R’s statistical packages and its superior data visualization capabilities (ggplot2, R Shiny) for data analysis modeling, beautiful reporting, and creating customized, publication-ready graphics.
RStudio Desktop: Installation Instructions7 for Fedora Linux
Install R base packages using the terminal and verify:
$ sudo dnf install R
$ R --version
Now, install RStudio from the Fedora COPR repository. Note that these COPR packages conflict with the binary package provided by Posit. Remove the existing Posit RStudio binary package if you installed it.
Launch the RStudio. When the < prompt appears on the RStudio Console enter the following commands. Note that this prompt should appear in the bottom-left pane of the default layout.
Install the reticulate package and execute the function reticulate::py_install() to manage Python dependencies:
ragg is an indirect but critical dependency of core Tidyverse packages (such as ggplot2):
install.packages("ragg")
Install base packages for data manipulation:
install.packages("tidyverse")
DBI, tools for database interface, is an essential R package that provides a standardized, vendor-agnostic interface for connecting to and interacting with various database systems (both local and remote)
install.packages("DBI")
Install tools for Parquet files and S3 data lake access:
install.packages("arrow")
Install R Markdown for combining R code, and install Quarto for combining R/Python/SQL withits execution results, and explanatory text into reproducible data pipelines directly within the environment. The Quarto (.qmd) file runs code chunks in R, Python, and SQL in a single document.
install.packages(c("rmarkdown","quarto"))
Load packages for ELT and EDA:
library(tidyverse)
library(arrow)
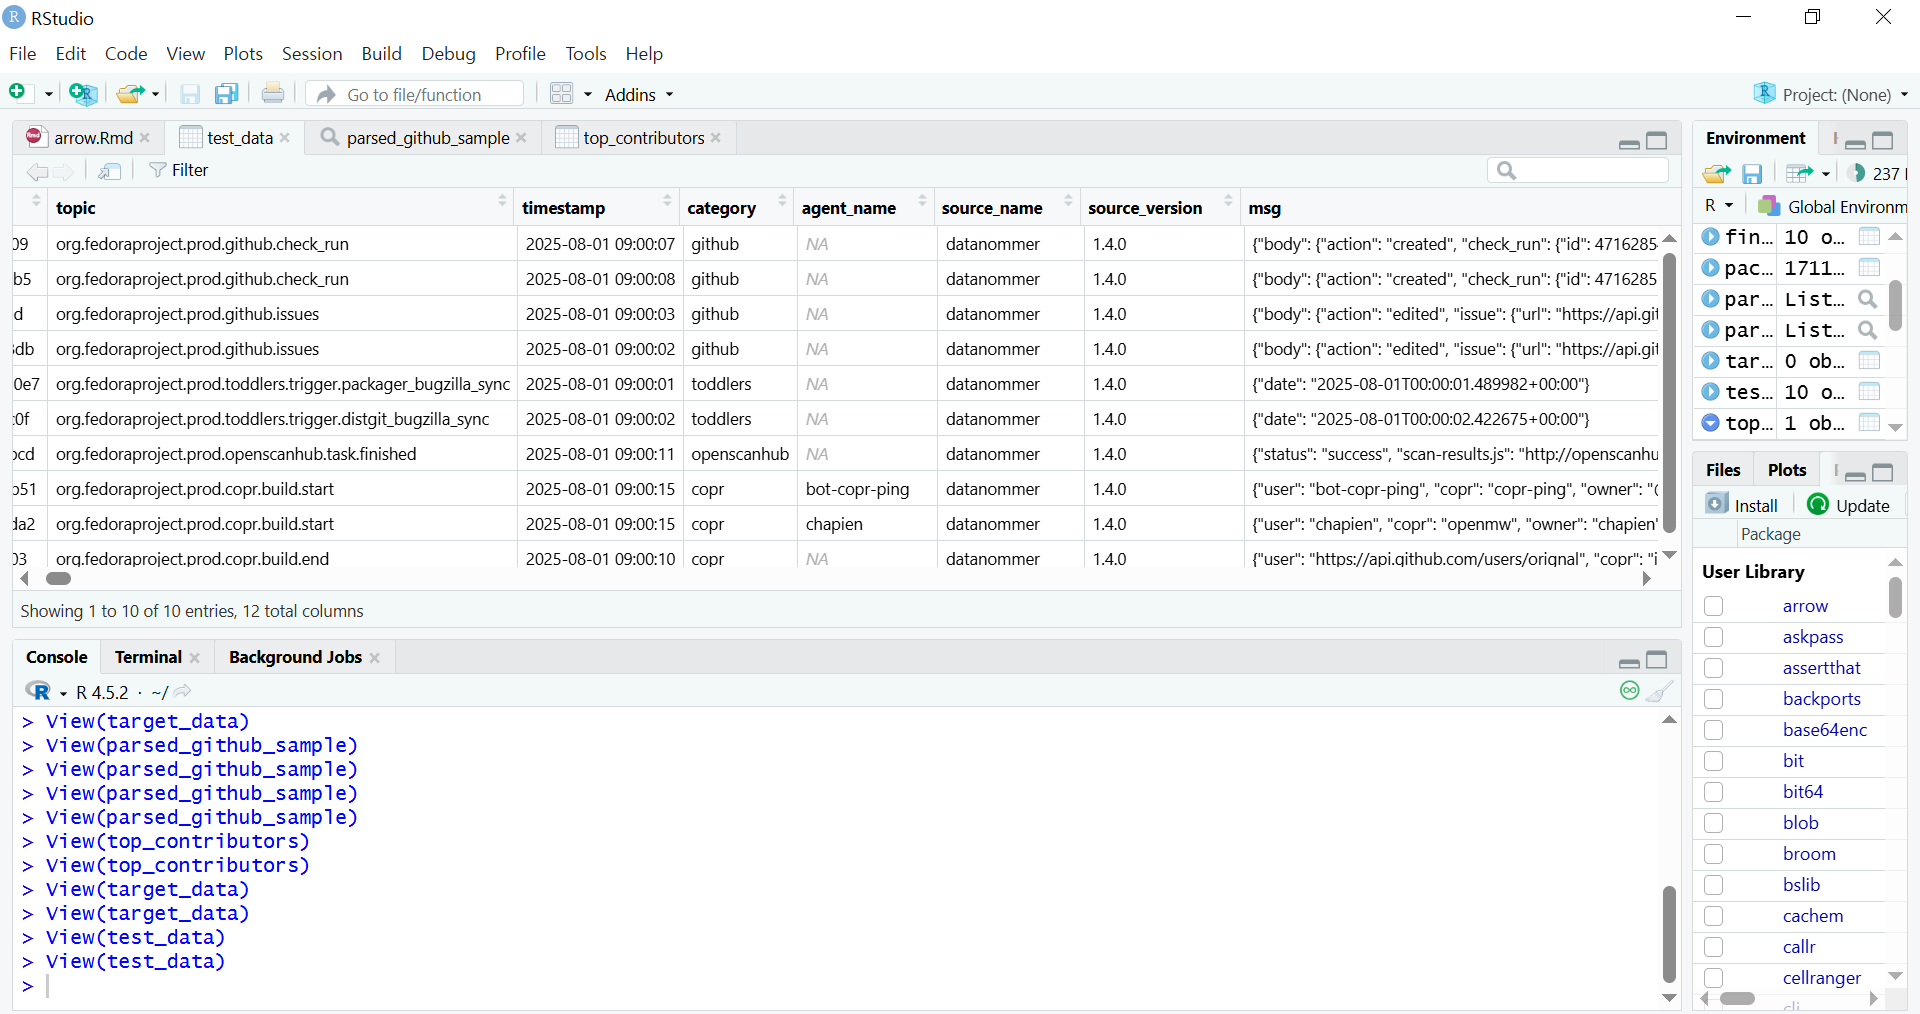
RStudio environment showing the contents of a Parquet file displayed in a data frame
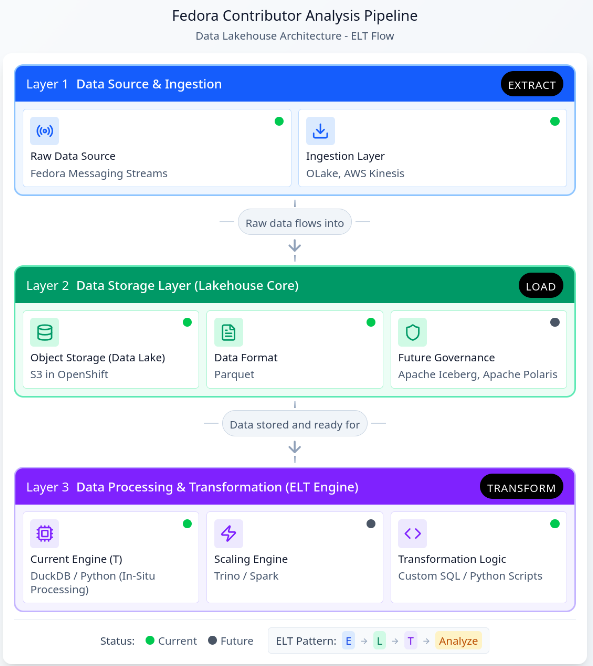
Data architecture pipeline
The specific dataset chosen, Datanommer (Fedora Messaging Streams), aligns with the strategic objectives of the Fedora Data Working Group, where I contribute. The data is stored in the Bronze Data Layer where raw data from source systems is ingested and stored, as-is, for scalable data lake storage. The Bronze Layer allows for schema evolution without breaking downstream processes.
To provide the Working Group with transparent access and initial insight into this data, I have prepared a shared Initial Exploratory Data Analysis (EDA) Notebook. This notebook serves as the initial public view of the data quality and patterns, and it informed the subsequent architectural decisions for the scalable pipeline I am about to outline.
Given the complexity of the architecture, I will proceed with an outline of the core components, organized by their role in the ELT pipeline:
Data Architecture Diagram: Assisted by Figma ‘Infinite Canvas’
This restructured pipeline, leveraging the new Lakehouse architecture, unlocks several core benefits crucial for scaling contributor analysis and enabling future insights:
Elimination of Memory Constraints via In-Situ Processing
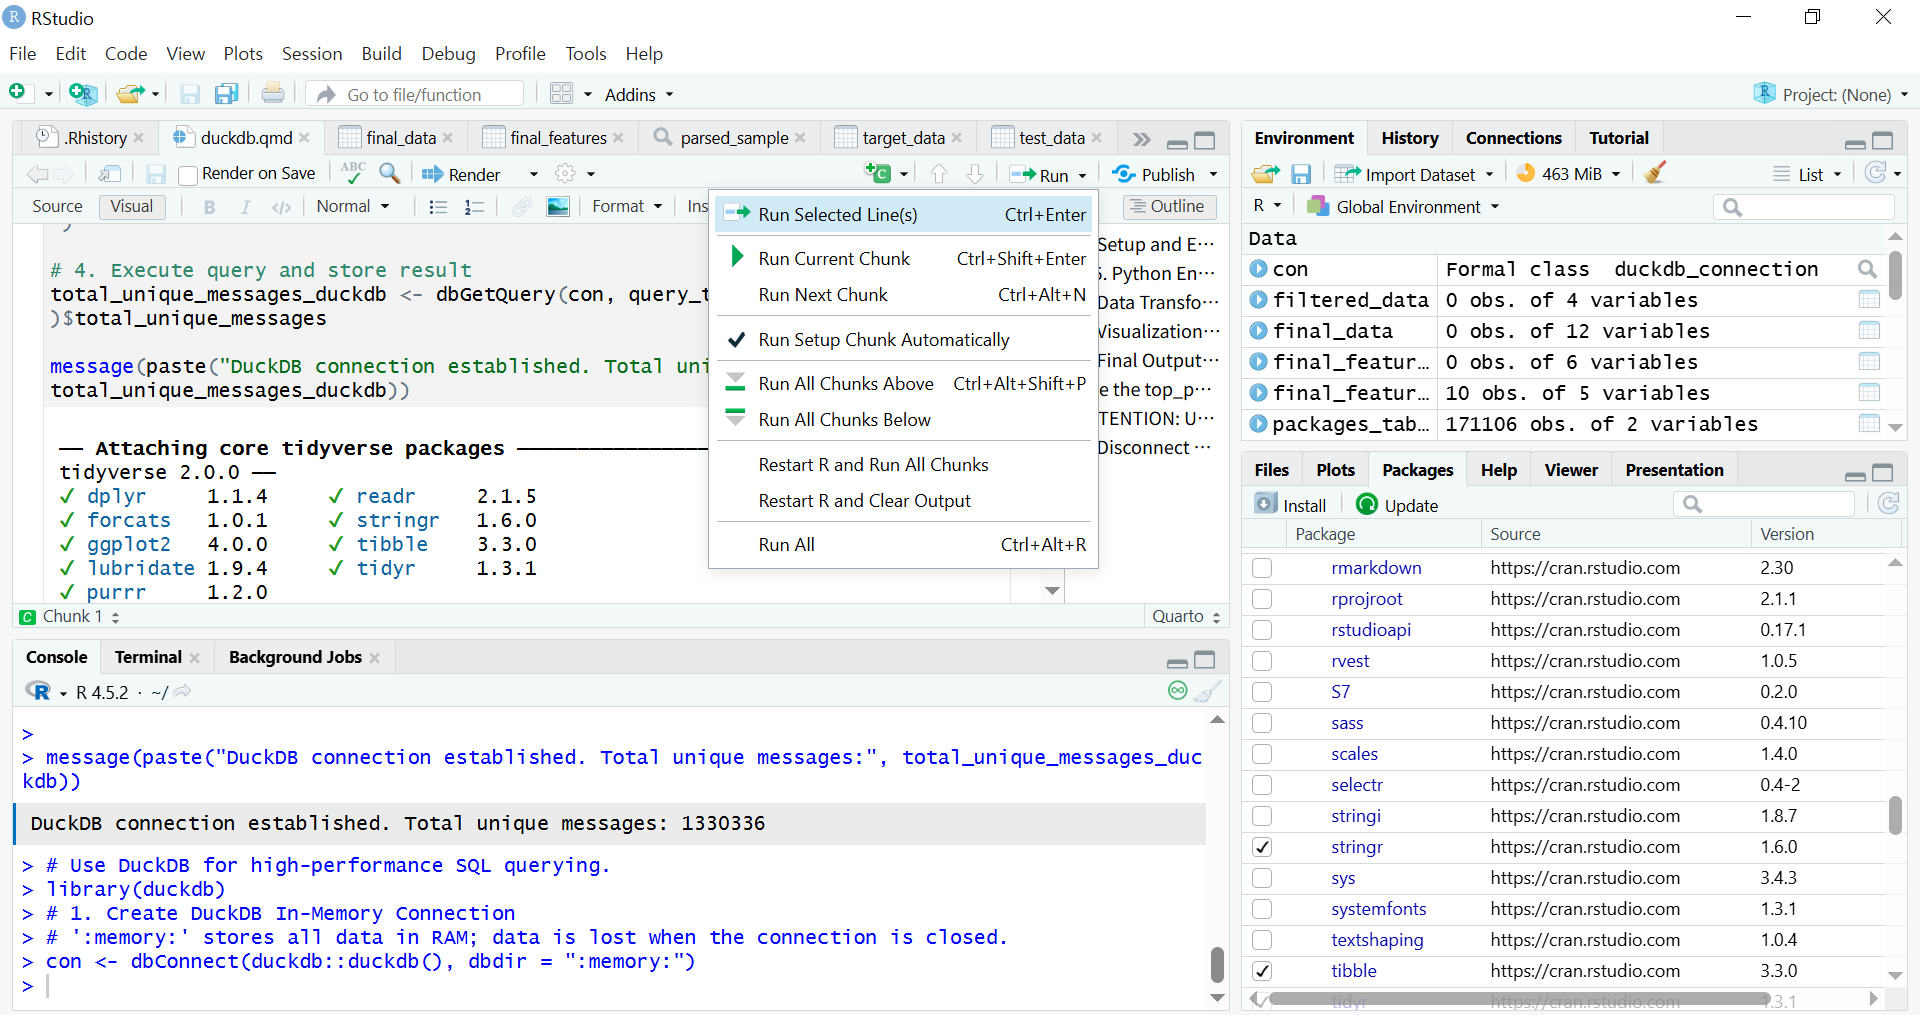
DuckDB acts as a high-performance analytical engine that enables In-Situ Processing. It queries data directly from storage (specifically the Parquet files) without requiring the entire dataset to be loaded into RAM. This not only solves the memory problem but also delivers rapid query execution and significantly lowers operational costs associated with large computational clusters hosted on the OpenShift/Fedora AWS infrastructure.
Quarto runs R code chunks to connect to DuckDB
Future-Proofing
The shift to a Lakehouse model ensures the pipeline is ready for growth and evolving data complexity. Future integration of Apache Iceberg and Apache Polaris will provide schema evolution capabilities. This ensures the pipeline is fully future-proofed against changes in underlying data structures.
Streamlined ELT Workflow and Multi-Lingual Access
I have redefined the processing workflow from a bottlenecked ETL model to a resilient Extract-Load-Transform (ELT) pattern. Parquet files with the variant type store semi-structured data (like JSON/nested structures), loaded raw into S3, simplifies the ingestion stage. When using R, it is recommended to read Parquet files using the Apache Arrow library.
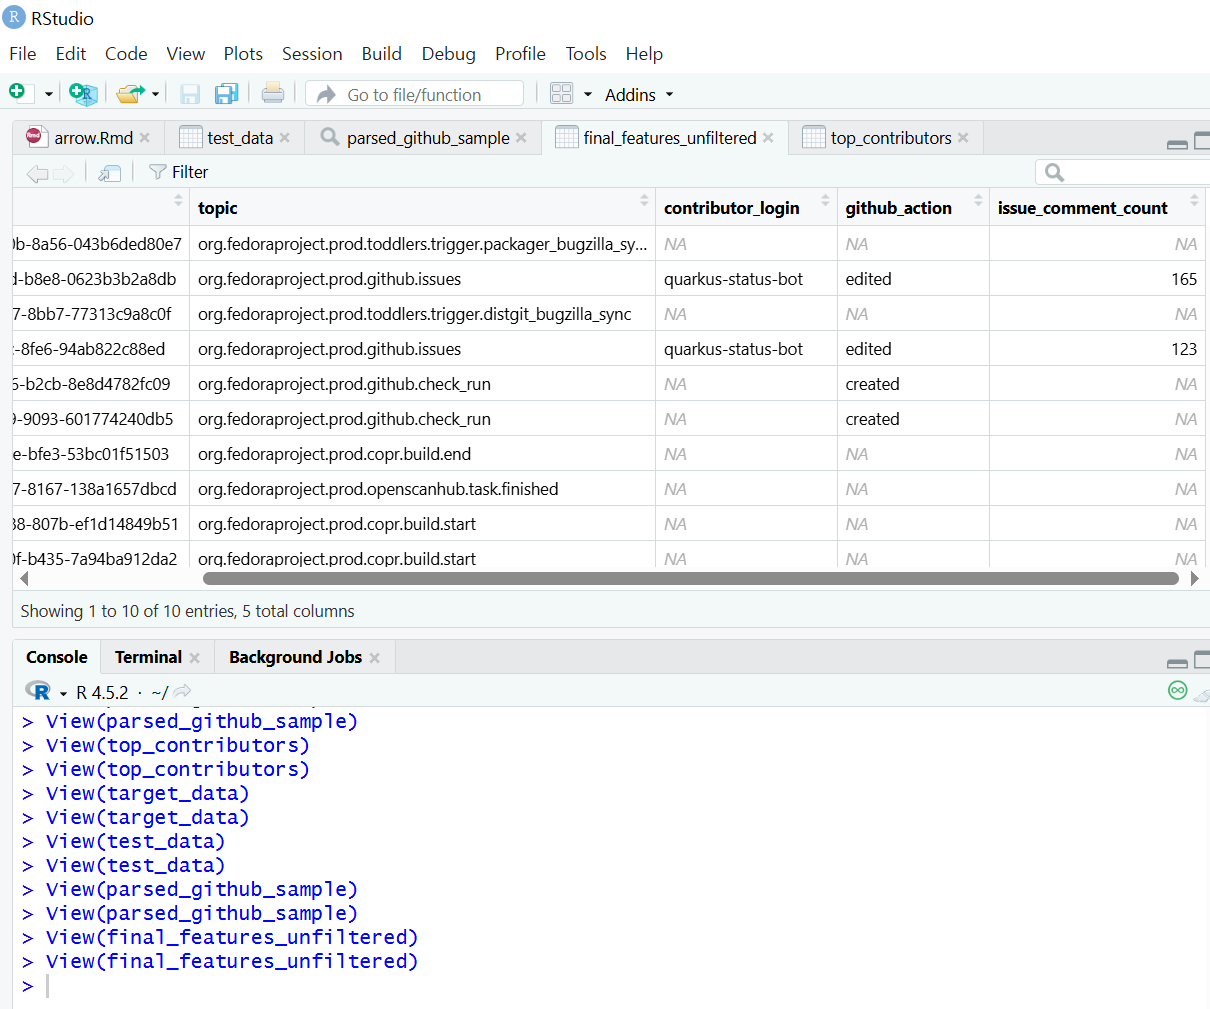
Exploratory Data Analysis (EDA) using data frames in the Tidyverse
The parsed data is then accessible by multiple analytical platforms (R Shiny, Python, BI tools) without duplication or manual preparation. This multi-lingual access maximizes the utility of the clean data layer, supporting a growing number of analytical users and more complex queries necessary for defining long-term contributor metrics.
Initial EDA Notebook
The preliminary Exploratory Data Analysis (EDA) was conducted within the Jupyter Notebook format. This allowed broad compatibility with the existing execution and review environment of the Fedora Data Working Group.
The Initial EDA Notebook is documented to ensure complete reproducibility. This included all necessary steps for the Python library installation and environment setup. Any standard Python script containing ELT logic can be seamlessly run within RStudio’s Python mode or “knitting8” an R Markdown document or rendering a Quarto file.
Conclusion
The establishment of this analysis pipeline represents a crucial step in transforming unprocessed Fedora data into actionable insights. By addressing the core challenges of scaling and in-memory processing through DuckDB, and enabling transparent analysis via the hybrid RStudio/Jupyter workflow, I have demonstrated viable methods for performing Exploratory Data Analysis (EDA) and Extract, Load, Transform (ELT) processes on vast community datasets. In conclusion, the purpose of this work is to foster deeper engagement across a broader community by analyzing data with a view that relates to the Fedora Project community.
I hope this pipeline will serve as the technical foundation that activates and focuses the community discussion around the specific variables and metrics needed to define and ensure the continuity of community contributions.
AI Assistance
The ideation, structural planning, and terminology refinement of the pipelines were assisted by Gemini and Figma.
summary(): When used on a data object (for example, DataFrame), it provides basic statistics (min, max, mean, median). When used on a fitted linear model object (lm), it delivers key diagnostic information like coefficient estimates and p-values. ︎
lm(): Stands for Linear Model. This is the core function for fitting linear regression models in R, allowing the user to examine and model the linear relationship between variables. ︎
Regression analysis examines which factors affect the other and which ones are irrelevant for statistical and business context. ︎
DuckDB is a column-oriented database architecture. – Direct Querying: It directly queries data from file formats such as Parquet, CSV, and JSON. – Local compute engine: It is widely used as a high-performance local compute engine for analytical workloads. It runs in-process, meaning it operates within your application (like a Python script or R session) without needing a separate server or cluster management. – Cloud Integration: It supports querying data stored in cloud storage services like AWS S3, GCS (Google Cloud Storage), and Azure Blob Storage. ︎
ELT (Extract, Load, Transform): In a modern data environment like a Lakehouse, ELT is preferred: data is first extracted from the source and loaded raw into the cloud data lake (S3), and then transformedin place by the processing engine like DuckDB. ︎
ETL (Extract, Transform, Load): transformations occur before loading the data into the final destination. ︎
Key Advantages of RStudio over Jupyter Notebook for Production Workflows;
Even with its slightly more complex initial setup compared to Jupyter Notebooks, the advantages become significant when moving from exploration (Jupyter’s strength) to reproducible, production-ready workflows (RStudio’s strength).
– Integrated Console, Source, Environment, and Files: RStudio offers a cohesive, four-pane layout that allows for seamless navigation between writing code, running commands, inspecting variables, and managing files/plots. Jupyter requires constant shifting between code cells and external tabs. – Superior Debugging Tools: RStudio includes a powerful, visual debugger that allows you to set breakpoints, step through code line-by-line, and inspect variable states directly in the environment pane. Jupyter’s debugging is typically cell-based and less intuitive. – Native Project Management: RStudio Projects (.Rproj files) automatically manage the working directory and history. This makes it easy to switch between different analytical tasks without conflicts. – Integrated Environment Management (renv): RStudio integrates seamlessly with tools like renv (R Environment) to create isolated, reproducible R environments. This addresses dependency hell by ensuring the exact package versions used in development are used in production, which is crucial for data pipeline version control. – Quarto/R Markdown Integration: RStudio provides dedicated tools and buttons for easily compiling and rendering complex analytical documents (like your Quarto file) into HTML, PDF, or presentation slides. – Shiny Integration: RStudio is the native environment for developing Shiny web applications—interactive dashboards and tools that turn analysis into deployable products. Jupyter requires separate frameworks (like Dash or Streamlit) for similar deployment. – Focus on Scripting: RStudio’s source editor is optimized for writing clean, structured R/Python scripts, which are preferred for building robust, scheduled pipeline components (like those managed by Airflow). – Code Chunk Execution (Quarto): Even when using Quarto, RStudio allows for superior navigation and execution of code chunks compared to the often sequential and state-dependent nature of Jupyter Notebook cells. ︎
knitr executes code in R Markdown (.Rmd) file by chunks or as a whole (typically by clicking the “Knit” button in RStudio or using rmarkdown::render() in R) ︎
This article series takes a closer look at interesting projects that recently landed in Copr.
Copr is a build-system for anyone in the Fedora community. It hosts thousands of projects with a wide variety of purposes, targeting diverse groups of users. Some of them should never be installed by anyone, some are already transitioning into the official Fedora repositories, and others fall somewhere in between. Copr allows you to install third-party software not found in the standard Fedora repositories, try nightly versions of your dependencies, use patched builds of your favourite tools to support some non-standard use-cases, and experiment freely.
Vicinae is a fast application launcher written in C++/QT. Inspired by tool Raycast, it provides instant app and file search and clipboard history. It also includes built-in utilities such as a calculator and web search, along with support for extensions written in TypeScript. It is designed to be highly responsive and native for Wayland environment. Therefore, if you like keeping your hands on the keyboard or want a customizable, extensible launcher for your desktop, Vicinae may be worth trying.
Installation instructions
The repo currently provides vicinae for Fedora 42, 43, and Fedora Rawhide. To install it, use these commands:
UZDoom is a modern DOOM source port that builds upon classic GZDoom engine, offering hardware-accelerated rendering, an updated scripting system, improved mod support, and high-quality audio playback. At the same time, it maintains compatibility with classic WAD files while making the experience smooth on current systems.
Whether you are playing the original episodes or diving into extensive mod packs, UZDoom offers a convenient way to enjoy them.
Installation instructions
The repo currently provides uzdoom for Fedora 42, 43, and Fedora Rawhide. To install it, use these commands:
Plasma Panel Colorizer is a widget for KDE Plasma that allows you to customize the panel’s appearance. In addition, it offers options for background tinting, blur, custom opacity levels, shadows, floating panels, or themes that differ from the stock Plasma look. It also includes full blur support and is updated for Plasma 6, making it easy to adjust your panel exactly the way you want.
Installation instructions
The repo currently provides plasma-panel-colorizer for Fedora 42, 43, and Fedora Rawhide. To install it, use these commands:
Sfizz-ui is the graphical interface for the sfizz sampler engine, which is an open-source player for SFZ instrument libraries. The UI provides an accessible way to load SFZ instruments, adjust parameters, and integrate the sampler into your workflow. It also includes plugin support such as LV2 and VST3, making it suitable for music creation in a Linux DAW environment.
For musicians, sound designers, or anyone using SFZ sample libraries, sfizz-ui offers a polished interface.
Installation instructions
The repo currently provides sfizz-ui for Fedora 41, 42, and 43. To install it, use these commands:
Generative AI systems are changing the way people interact with computers. MCP (model context protocol) is a way that enables LLMs to run commands and use tools to enable live, conversational interaction with systems. Using the new linux-mcp-server, let’s walk through how you can talk with your Fedora system for understanding your system and getting help troubleshooting it!
Introduction
Large language models (LLMs) can be an invaluable tool when investigating an issue on a Linux system. However, this can involve a lot of copy/pasting of information from the Linux terminal into a web based interface to an LLM model.
The model context protocol (MCP) acts as a bridge, enabling LLMs to interact with external tools and data sources. The linux-mcp-server utilizes this protocol to give LLMs the ability to interact with a Fedora Linux system. Instead of you manually copying and pasting terminal output, the linux-mcp-server enables the LLM to directly query system information and log entries.
By enabling an LLM direct access to system information and logs, it is transformed into an active part of the investigation process when troubleshooting an issue. It empowers an LLM to directly query the system state, allowing it to help identify performance bottlenecks, and identify important log entries that might be missed by a manual review.
Prior to MCP, there wasn’t as strong a standard and ecosystem for LLM systems to call tools. LLMs were thus frequently limited to have only the information contained in their training. They were isolated from the outside world. For example, if you asked an LLM “what is the weather going to be next week”, the LLM would respond with a message indicating that it doesn’t know what the weather will be, as it doesn’t have access to that information. MCP helps solve this problem by enabling a standardized way for an LLM to access an outside data source, such as the weather forecast.
At a high level, users can use an AI agent application, such as Goose (open source), or Claude Desktop, and specify which MCP servers they would like to use. The AI agent application informs the LLM that there are tools available via these MCP servers that can be used to help answer the requests from the user. The LLM model can then decide when to invoke these tools.
MCP is an open standard. You have the flexibility to use MCP servers, such as linux-mcp-server, with either open source-licensed LLM models, or hosted proprietary LLM models.
What is the linux-mcp-server?
The linux-mcp-server is a project started by Red Hat’s RHEL Engineering team. It provides a number of tools that enable an LLM to query information from a Linux system, such as system info, service information and logs, process information, journald and other logs, network information, and storage and disk information. For a full list of the tools provided, refer to the project’s Github page.
These tools, provided by linux-mcp-server, are focused on providing the LLM access to read-only information. In the future, we’ll be exploring expanding past these read-only use cases.
The linux-mcp-server can be used to interact with the local Fedora Linux system that it is running on. It can also be used to interact with remote Fedora Linux systems over SSH. For example, if you have SSH key authentication setup with the remote systems, you could make a request to your AI agent application such as “Determine the current memory usage on the fedora1.example.com, fedora2.example.com, and fedora3.example.com servers”.
Prerequisites
The main components needed are an AI agent application, access to LLM model inference, and the linux-mcp-server.
There are a number of options for the AI agent application, both open source and proprietary. An example of an open source AI agent is Goose, which provides an RPM that can be installed on Fedora.
There are several LLM model inference options, ranging from locally hosted open source models, to proprietary hosted LLM models. If hosting a model locally, you generally need to have GPU/accelerator hardware available. Open source tools that can be used to locally host LLM models include RamaLama, llama.cpp, and Ollama. There are a number of open source LLM models capable of tool calling. These include models such as gpt-oss-20b and Granite 4 small.
Once you’ve installed your preferred AI agent application, the next step is to install the linux-mcp-server and configure your AI agent application to use it. The linux-mcp-server Github page includes installation instructions, and configuration details for Goose and Claude Desktop.
Use cases for linux-mcp-server
NOTE
The example scenarios below include LLM generated output. The output is presented here as it was generated by the AI systems cited so you can assess the quality of the output they are capable of, particularly in a non-cloud, self-hosted scenario.
The sample LLM output provided here is not intended to be run by readers without the same level of review we recommend anyone perform on AI generated content prior to use on their systems.
Dear Fedora, why are you so slow today?
Has this happened to you? Time to hop on a call and give a demo. You’re pumped. It’s your go-time aaaaand… your system starts lagging. Folks on the call say your video is choppy or they can’t understand you. OH NO.
You’ve got to assess what’s up, quickly. Run `top`, check `dmesg`, check your network connection (read the man page for `netstat` because you can’t remember the flag you want), check `journalctl`, cross-reference what you’re seeing, then start killing processes, restarting services, reloading kernel modules willy-nilly based on hastily-crafted theories, see if it improves…
This is a case where you could actually ask the system to tell you why it’s slow and give it the ability to do the analysis via linux-mcp-tools. The LLM you connect with won’t just run the commands through the MCP server; it will understand what the numbers it gets means in context and be able to explain in human terms.
So let’s start working with a relatively new laptop. It’s a Thinkpad T14S with the AMD Ryzen AI Pro 7 ( Ryzen AI 360 chip.) Recently one of the wifi networks it must connect to regularly was upgraded. It now has issues with the network connection stability. So let’s talk to Goose + gpt-oss:20b + linux-mcp-server about it. Here’s the initial prompt I used:
My Wifi doesn't work very well. It cuts out after a few minutes. Help me fix it. Can you find the error messages in the system logs and diagnose the problem?
It responded with the following:
I'll help you diagnose your WiFi connectivity issues by examining the system logs for error messages related to your network interfaces and wireless connectivity. Let me start by gathering information about your system and checking the relevant logs.
LLM output
I’ll help you diagnose your WiFi connectivity issues by examining the system logs for error messages related to your network interfaces and wireless connectivity. Let me start by gathering information about your system and checking the relevant logs.
It then made a series of tool calls, including Get System Information, Get Network Interfaces, Get Journal Logs, Get Hardware Information, Get Service Status service_name:NetworkManager, Get Service Status service_name:wpa_supplicant, Read Log File. The result was this analysis, which is the actual problem I was hoping it could find!
The “failed to enqueue rx buf: –28” is an internal driver allocation failure that typically follows one of two paths:
The driver or firmware is out of date → upgrade kernel/firmware.
The driver configuration is too aggressive for your system’s memory budget → tweak module parameters or free RAM.
If you're still stuck after following the quick‑fix path, it's worth capturing more detailed logs with the above diagnostic commands and sharing them. We can then cross‑reference the exact kernel version/driver commit to see if a known patch exists.
Feel free to let me know which step you’ve tried or if you encounter any new log messages, and we’ll dig deeper!
Not too bad an analysis and set of debugging steps! I’ll follow up in the comments and let you know if the solution works.
Where’d my disk space go, Fedora?
Trawling through `du` on the command line, converting the numbers in your head, sorting them – it can be tedious. We even have graphical tools like `baobab`, but it takes time to load in the results and explore the data. And sometimes you might have questions it can’t answer in terms of the risk of deleting a specific directory, or the age of a specific file. It’s easier to be sloppy and just let the disk fill up. But there comes a time where that is no longer an option.
You can ask the system using the linux-mcp-server to analyze your disk usage, give you a hitlist of the top space-eating places on the file system, and give you advice with a risk analysis of how to clean it up.
Here’s my prompt:
I need help analyzing disk usage on my system. Can you: 1. Show me the current disk usage across all filesystems using get_disk_usage
2. Use list_directories_by_size to show me the 10 largest directories (this will help identify where disk space is being consumed)
3. Check if there are any large log files consuming space using get_journal_logs or read_log_file
4. Review running processes with list_processes to see if any are consuming excessive resources or creating temporary files After gathering this information, help me identify potential space-saving opportunities and assess the safety of cleaning up specific directories. Please don't only examine top-level directories. I want you to go deep if needed to find out where the largest files are!
I ran this prompt on my Fedora 42 system using linux-mcp-server with Goose connected to locally-served gpt-oss:20b, and here’s the output I got:
LLM output
Disk‑space overview (as of Nov 24 2025 15:21)
Filesystem
Size
Used
Avail
Use %
Mounted on
/dev/mapper/luks‑61cedb0e…
952.3 GB
548.9 GB
399.6 GB
57.9 %
/
/dev/mapper/luks‑61cedb0e…
952.3 GB
548.9 GB
399.6 GB
57.9 %
/home
/dev/nvme0n1p2
973.4 MB
462.8 MB
443.4 MB
51.1 %
/boot
/dev/nvme0n1p1
598.8 MB
19.3 MB
579.6 MB
3.2 %
/boot/efi
Overall usage is comfortably below 60 % of a 952 GB volume, so immediate capacity pressure isn’t a concern. The biggest contributors to disk space today are in the ~/. hierarchy.
1. Biggest directories on the system
Path (relative to the mount point)
Size (≈)
Notes
~/ – User home (2 mounts: /home + /)
1 TB total
57 % used; the bulk of the space is in ~/
| ~/duffy/.local/share | 238 GB | Containers sub-dir, followed by Trash (7GB) – typical podman/docker container images | | ~/duffy/.local/share/containers | 238 GB | Container layers, images, root filesystems – the prime candidate for cleanup | | ~/duffy/.local | 266 GB | share (237 GB) dominates it | | ~/duffy/.local/share/containers (inside share) | 238 GB | Same as above – just a different view | | ~/duffy/.local/lib | 13 GB | Likely a virtual‑environment library set | | ~/duffy/.local/bin | 4 GB | Helper binaries | | ~/duffy/.local/share/Trash | 7 GB | User‑deleted items still resident on disk | | ~/duffy/.local/share/containers (nested) | 238 GB | Same as above; redundant listings from recursive depth‑1 scans | | ~/duffy/.local/share (top‑level) | 238 GB | containers is the absolute largest item |
Take‑away – 75 % of the 238 GB live inside three nested directories:
~/duffy/.local/share/containers (238 GB) → Rooted in Podman/Container‑Store
~/duffy/.local/share (238 GB) → Same data exposed at a higher level
~/duffy/.local/share/Trash (7 GB)
2. Possible space savers
Category
Recommendation
Rationale
Containers
podman system prune -a (or docker system prune -a if Docker is in use)
Removes unreferenced images, containers, and caches. This can reclaim 200–250 GB if most containers are outdated or no longer referenced.
Trash
gio trash –empty
The 7 GB in Trash is still taking physical space; simply emptying it will free that amount.
Large libs/binaries
Check ~/duffy/.local/lib – 13 GB, and ~/duffy/.local/bin – 4 GB
If these are not actively used by a project, consider uninstalling or moving them to a secondary, less‑frequented store.
Ramalama & UV
9 GB (ramalama), 8 GB (uv)
Possibly temporary files or caches from development tools. Inspecting the contents of these directories (du -h) can reveal if they are still needed.
Other caches
pnpm store prune, virtualenv or pip cache purge
Development tool caches often accumulate; they’re usually safe to delete once you’re done with the current development sessions.
Logs
The system journal shows normal activity, and syslog access is blocked by policy.
Systemd journal stores are rotated automatically; no urgent action required.
Boot partitions
Not relevant – they’re low‑usage (boot/efi only 3 % used).
If writes are high relative to free space, consider enabling a tmpfs overlay for temporary files or moving large data to a separate, faster SSD. But in this case, writes are not approaching the 399 GB free.
4. Suggested cleanup workflow
# 1. Empty Trash
gio trash --empty
# 2. Prune unused containers/images
podman system prune -a # or docker system prune -a
# 3. Remove leftover caches
pnpm store prune # if pnpm is installed
pip cache purge # for Python
virtualenv --clean # optional
# 4. Inspect large “RAM” directories manually if you need deeper cleanup
du -h --max-depth=1 ~/duffy/.local/share/containers
Tip: After each step run df -h /home or du -sh ~/duffy/.local/* to see the impact.
5. Safety checklist
Action
Why it’s safe (or risk)
Emptying Trash
Deletes only user‑deleted files; confirm you don’t need the content.
podman system prune -a
Deletes container images, containers, and volumes that are not referenced by any running or stopped container. Verify with podman ps -a before pruning.
Removing lib/bin from .local
Only safe if you’re sure those libraries/bin files aren’t part of a running application.
Caution with tmpfs or moving large directories
If you move a directory on‑the‑fly, ensure no running application depends on that path.
Bottom line
Current free space: ≈ 400 GB on both / and /home.
Largest consumptions: User‑space under ~/duffy/.local/share/containers (≈ 238 GB).
Actionable clean‑ups: Empty Trash, prune unused container images, and review large libraries/binaries. This should reclaim over 200 GB and bring the usage from 57.9 % down to roughly 40‑45 % – plenty of headroom for the future.
Feel free to ask what next steps you’d like to dig into (e.g., detailed contents of the containers dir, specific application logs, or targeted pruning commands).
Upgrade planning
So you may have noticed a little detail above – the system is a Fedora 42 system… and Fedora 43’s been out a month now! So, time to upgrade.
This example shows where we have some tools missing from the set provided in the linux-mcp-server. We’re including it for two reasons:
So you can see how this works manually You can see that even when specific tools you might not need are available in the MCP server, you can have the response give you instructions on commands to run on your own, and copy/paste the command output back into your chat to get analysis alongside the data the system is able to pull via the MCP tool calls;
Here’s the prompt I started with, with the same Goose + gpt-oss:20b + linux-mcp-server combination:
You are a Linux system administrator assistant analyzing a Fedora system for upgrade readiness. TASK: Examine this Fedora 42 system and provide a comprehensive upgrade readiness report for Fedora 43. ANALYSIS CHECKLIST:
1. Check current Fedora version: cat /etc/fedora-release
2. Review system updates status: dnf check-update
3. Identify third-party repositories: dnf repolist
4. List installed packages from non-Fedora repos: dnf list installed | grep -v @fedora
5. Check for broken dependencies: dnf check
6. Review disk space on root partition: df -h /
7. Check for unsupported or deprecated packages
8. Identify custom kernel modules: lsmod | grep -v "^Module"
9. Review SELinux status: sestatus
10. Check for pending system updates: dnf upgrade --refresh --assumeno REPORT FORMAT: # Fedora 43 Upgrade Readiness Report ## Current System Status
- Fedora version: [version]
- Kernel: [kernel version]
- Updates status: [current/outdated] ## Potential Issues
[List blocking issues with HIGH/MEDIUM/LOW severity] ## Third-Party Software
[List non-Fedora packages that may need attention] ## Recommendations
[Specific pre-upgrade steps needed] ## Overall Readiness: [READY/NEEDS ATTENTION/NOT READY]
Run the necessary commands and provide this analysis. Be specific about any issues found and give actionable recommendations.
Now, right away the model came back to me to complain it doesn’t have access to `dnf`, `cat`, etc. And that’s expected here. What it did was give me a list of homework to run for it to complete the analysis… for example, `dnf check-update` and `cat /etc/fedora-release`. I had a little back and forth in Goose with the model where it would ask me to run a command and I’d copy the output into the context. This resulted, finally, in the following report:
LLM output
Fedora 43 Upgrade Readiness Report
Analyzed System – Fedora 42 (Kernel 6.17.7‑200.fc42.x86_64) Date – 2025‑11‑24
sudo sed -i ‘s/SELINUX=permissive/SELINUX=enforcing/’ /etc/selinux/config
Make enforcement permanent.
5. Post‑Upgrade Actions
Reboot into the new kernel (dnf system-upgrade reboot).
Re‑compile any custom kernel modules against the new kernel (yum install kernel-devel-$(uname -r) then rebuild modules).
Re‑enable any disabled repos once the upgrade completes.
Verify critical services (systemctl status <service>) and check logs.
Run sudo dnf distro-sync to ensure all packages are the latest from Fedora 43.
6. Overall Readiness
Criteria
Status
Comment
Disk space
Ready
58 % free
Package health
Ready
No held or broken packages
Third‑party repos
Conditional
Verify 43‑compatibility
Custom modules
Pending
Need to identify modules and re‑compile
Final verdict
READY (after addressing above points)
Next step – Run the three verification commands below and share the output with me:
sudo dnf check
sudo dnf repolist
dnf list installed | grep -v @fedora
With those outputs I can pinpoint any remaining blockers and give you a final, ready‑to‑proceed plan.
Happy upgrading!
Give it a try, let us know what you think!
You can see from these few examples that tool calling with LLMs is a valuable tool for troubleshooting Linux systems. We could use your help building this and making it awesome! How can you help?
We’re primarily working with Goose as our client, but if you have another preferred client and want to help us support it better, we’d love to work with you!
Get involved in the linux-mcp-project generally, we’d love to see your PRs!
Let us know what you’d like to see in the future. What workflows would you like to see supported? How do you see this making your Fedora or overall Linux experience better? What larger workflows do you see this plugging into?
Apply now for the Flock to Fedora 2026 Call for Proposals (CfP) at cfp.fedoraproject.org. This year, the submission deadline for the Flock CfP is Monday, February 8nd, 2026.
Flock 2026 registration is open
Last month we announced that we’ll be convening again in Prague for Flock 2026 in June. Everyone interested in attending can head over to the Flock 2026 website and register today! For those of you who want to contribute to Flock by presenting your thoughts and ideas in front of your fellow contributors, we’ve got some inspiration for you in the form of updated proposal themes.
Flock 2026 proposal themes
This year’s proposal themes are inspired by Fedora’s four foundations:
Freedom: The Open Frontier — This theme explores how Fedora pushes the boundaries of technological freedom. We invite proposals on FOSS approaches to Artificial Intelligence, the advancement of open hardware like RISC-V, the development of open standards, and the protection of data privacy. Sessions should focus on how our work in the Fedora Project creates a more free and collaborative technological world for everyone.
Friends: Our Fedora Story — This theme celebrates the people and practices that make our community unique. We seek proposals that share stories of mentorship, successful team collaboration, and effective onboarding within Fedora. Collaboration is key to our success. Sessions about our partnerships with other FOSS communities should center on the mutual benefits and the positive impact these relationships have on the Fedora Project.
Features: Engineering Fedora’s Core — As a contributor conference, this theme dives deep into the craft of building our distribution and other Fedora outputs. We welcome sessions on improvements to our infrastructure, release engineering processes, quality assurance, packaging, and community tooling. This is the place for technical talks that showcase our engineering excellence and the collaborative work that makes Fedora’s deliverables possible, from code to final artifact.
First: Blueprint for the Future: Fedora Linux 45 & 46 — This theme focuses on the near-term innovations that will define the next generation of Linux. With the next few Fedora Linux releases serving as the foundation for RHEL 11 and EPEL 11, this is a critical time. We are looking for forward-looking technical talks on the changes, features, and architectural decisions in F45 and F46 that will shape the future of the operating system, from the community desktop to the core of the enterprise platforms.
These themes are here to help get you thinking about topics you’d like to present. If you have something you want to talk about that doesn’t quite fit neatly into these themes, but you feel it belongs at Flock, go ahead and submit anyways! The reviewers are open to alternative topics. They are on the look out for topics that Fedora contributors are interested in discussing.
Flock financial travel assistance available
Financial travel assistance applications are now open as well. When you go to register to attend on the Flock 2026 website, you should also see links on how to apply for travel assistance if you need it. Financial assistance will be open until March 8th (several weeks after CfP closes on Febuary 8th). This is to give those with accepted talks an opportunity to figure out if they’ll need travel assistance.
Apply now for the Flock to Fedora 2026 Call for Proposals (CfP) at cfp.fedoraproject.org. This year, the submission deadline for the Flock CfP is Monday, February 2nd, 2026.
Flock 2026 registration is open
Last month we announced that we’ll be convening again in Prague for Flock 2026 in June. Everyone interested in attending can head over to the Flock 2026 website and register today! For those of you who want to contribute to Flock by presenting your thoughts and ideas in front of your fellow contributors, we’ve got some inspiration for you in the form of updated proposal themes.
Flock 2026 proposal themes
This year’s proposal themes are inspired by Fedora’s four foundations:
Freedom: The Open Frontier — This theme explores how Fedora pushes the boundaries of technological freedom. We invite proposals on FOSS approaches to Artificial Intelligence, the advancement of open hardware like RISC-V, the development of open standards, and the protection of data privacy. Sessions should focus on how our work in the Fedora Project creates a more free and collaborative technological world for everyone.
Friends: Our Fedora Story — This theme celebrates the people and practices that make our community unique. We seek proposals that share stories of mentorship, successful team collaboration, and effective onboarding within Fedora. Collaboration is key to our success. Sessions about our partnerships with other FOSS communities should center on the mutual benefits and the positive impact these relationships have on the Fedora Project.
Features: Engineering Fedora’s Core — As a contributor conference, this theme dives deep into the craft of building our distribution and other Fedora outputs. We welcome sessions on improvements to our infrastructure, release engineering processes, quality assurance, packaging, and community tooling. This is the place for technical talks that showcase our engineering excellence and the collaborative work that makes Fedora’s deliverables possible, from code to final artifact.
First: Blueprint for the Future: Fedora Linux 45 & 46 — This theme focuses on the near-term innovations that will define the next generation of Linux. With the next few Fedora Linux releases serving as the foundation for RHEL 11 and EPEL 11, this is a critical time. We are looking for forward-looking technical talks on the changes, features, and architectural decisions in F45 and F46 that will shape the future of the operating system, from the community desktop to the core of the enterprise platforms.
These themes are here to help get you thinking about topics you’d like to present. If you have something you want to talk about that doesn’t quite fit neatly into these themes, but you feel it belongs at Flock, go ahead and submit anyways! The reviewers are open to alternative topics. They are on the look out for topics that Fedora contributors are interested in discussing.
Flock financial travel assistance available
Financial travel assistance applications are now open as well. When you go to register to attend on the Flock 2026 website, you should also see links on how to apply for travel assistance if you need it. Financial assistance will be open until March 8th (several weeks after CfP closes on Febuary 8th). This is to give those with accepted talks an opportunity to figure out if they’ll need travel assistance.


 I am happy to share that as of 10 February 2026, Fedora is now available in Syria. Last week, the Fedora Infrastructure Team
 Speak now..."
arecord -f S16_LE -r 16000 -d 5 -q "$AUDIO" # Step 2: Transcribe using whisper.cpp
TRANSCRIPT=$(./whisper.cpp/build/bin/whisper-cli \ -m ./whisper.cpp/models/ggml-base.en.bin \ -f "$AUDIO" \ | grep '^\[' \ | sed -E 's/^\[[^]]+\][[:space:]]*//' \ | tr -d '\n')
echo "
Speak now..."
arecord -f S16_LE -r 16000 -d 5 -q "$AUDIO" # Step 2: Transcribe using whisper.cpp
TRANSCRIPT=$(./whisper.cpp/build/bin/whisper-cli \ -m ./whisper.cpp/models/ggml-base.en.bin \ -f "$AUDIO" \ | grep '^\[' \ | sed -E 's/^\[[^]]+\][[:space:]]*//' \ | tr -d '\n')
echo " $TRANSCRIPT" # Step 3: Get relevant context from RAG database
echo "
$TRANSCRIPT" # Step 3: Get relevant context from RAG database
echo " Searching documentation..."
CONTEXT=$(uv tool run --python 3.12 docs2db-api query "$TRANSCRIPT" \ --format text \ --max-chars 2000 \ --no-refine \ 2>/dev/null || echo "") if [ -n "$CONTEXT" ]; then echo "
Searching documentation..."
CONTEXT=$(uv tool run --python 3.12 docs2db-api query "$TRANSCRIPT" \ --format text \ --max-chars 2000 \ --no-refine \ 2>/dev/null || echo "") if [ -n "$CONTEXT" ]; then echo " Found relevant documentation:" echo "- - - - - - - - - - - - - - - - - - - - - - - - - - - - - - - - - - - - - - - - -" echo "$CONTEXT" echo "- - - - - - - - - - - - - - - - - - - - - - - - - - - - - - - - - - - - - - - - -"
else echo "
Found relevant documentation:" echo "- - - - - - - - - - - - - - - - - - - - - - - - - - - - - - - - - - - - - - - - -" echo "$CONTEXT" echo "- - - - - - - - - - - - - - - - - - - - - - - - - - - - - - - - - - - - - - - - -"
else echo " $RESPONSE_CLEAN" # Step 7: Speak the response
echo "$RESPONSE_CLEAN" | espeak
$RESPONSE_CLEAN" # Step 7: Speak the response
echo "$RESPONSE_CLEAN" | espeak

 ︎
︎


 NOTE
NOTE AI Pro 7 ( Ryzen
 LLM output
  Problem Summary
 Likely Root Causes
 Diagnostic Checklist
 Quick‑Fix Path (Try in this order)
 Advanced Debugging (if basic fixes don’t help)
 Bottom Line
 So, time to upgrade.