The Podman team and the Fedora Quality Assurance team are organizing a Test Week from Friday, February 27 through Friday, March 6, 2026. This is your chance to get an early look at the latest improvements coming to Podman and see how they perform on your machine.
What is Podman?
For those new to the tool, Podman is a daemonless, Linux-native engine for running, building, and sharing OCI containers. It offers a familiar command-line experience but runs containers safely without requiring a root daemon.
What’s Coming in Podman 5.8?
The upcoming release includes updates designed to make Podman faster and more robust. Here is what you can look forward to, and what you can try out during this Fedora Test Day.
A Modern Database Backend (SQLite)
Podman is upgrading its internal storage logic by transitioning to SQLite. This change modernizes how Podman handles data under the hood, aiming for better stability and long-term robustness.
Faster Parallel Pulls
This release brings optimizations to how Podman downloads image layers, specifically when pulling multiple images at the same time. For a deep dive into the engineering behind this, check out the developer blog post on Accelerating Parallel Layer Creation.
Experiment and Explore: Feel free to push the system a bit and try pulling several large images simultaneously to see if you notice the performance boost. Beyond that, please bring your own workflows. Don’t just follow the wiki instructions. Run the containers and commands you use daily. Your specific use cases are the best way to uncover edge cases that standard tests might miss.
Use the %autorelease and %autochangelog tags simplify package maintenance and make it easier to contribute packages to the Fedora Project. These rpmautospec tags cause no noticeable difference in the packages from the end user’s perspective. As of the Fedora Linux 38 release, package maintainers should use these new tags.
Information about package history
Every package in a distribution carries identifying information. For example, the latest version of Firefox is available as firefox-110.0-3.fc38.x86_64. This can be unpacked as:
a name (firefox),
a version (110.0),
a “release tag”, consisting of a packaging release version + a distribution marker + an architecture tag (3.fc38.x86_64).
In modern practice, the name and the version are supplied directly by the project upstream and unambiguously identify what was built. The release tag describes the downstream distro build (where, which distro, build count). This may sound natural, but in the past packagers would split parts of the upstream version into the release tag according to some rather complicated rules.
A package also contains useful information in its changelog.
Continuing with the Firefox example:
$ rpm -q --changelog firefox-110.0-3.fc38.x86_64 | head -n5
* Tue Feb 14 2023 Martin Stránský <stransky@redhat.com>- 110.0-3
- Updated to 110.0 build 3 * Mon Feb 13 2023 Martin Stránský <stransky@redhat.com>- 110.0-2
- Added fix for orca
The changelog is created by package maintainers. It describes changes to the package that are relevant to a user. New software versions, modified file paths, and important bugfixs are examples of things that would be mentioned in the changelog. Whitespace changes in packaging scripts and other cleanups are examples of things that would not be mentioned in the changelog. When things go well, users generally do not look at the changelog. However, the changelog is useful when a bug is found and people need to track down what changed, when, and why.
All this changelog information must be provided by the maintainer. When the maintainer builds a rpm package, they must provide this information in the appropriate fields of the package’s spec file.
For example, the firefox.spec might look like this:
Name: firefox
Version: 110.0
Release: 3%{dist}
...
%changelog
* Tue Feb 14 2023 Martin Stránský <stransky@redhat.com>- 110.0-3
- Updated to 110.0 build 3 * Mon Feb 13 2023 Martin Stránský <stransky@redhat.com>- 110.0-2
- Added fix for orca
...
This is the traditional way. Every time the maintainer makes a new build, they update the number in the Release field and add a corresponding entry in the %changelog section. For example, for the 110.0-3.fc38 build, Martin would have changed Release: 2%{dist} → Release: 3%{dist} and added the first paragraph under %changelog.
Packages in Fedora are maintained using git. This means that after making changes to the package, and adding some text to the changelog, the maintainer would also write a description of the changes in the git commit message. Often this is exactly the same text as the changelog. For example, for the 110.0-3.fc38 build, Martin wrote “Updated to latest 110.0 upstream build” in the git commit message. It should be noted that every commit in git also contains a name, the email address of the author, and a timestamp for the change. If this sounds a bit repetitive, that’s because it is. Thankfully, some of this can now be automated.
rpmautospec
The rpmautospec method takes advantage of the fact that the spec file is maintained in a git repository:
The purpose of the Release field is to identify the distro build number for a specific upstream Version. The Release field should be set to %autorelease and never changed again. The %autorelease macro provides a count of commits since the last commit that changed the Version field. This is nifty. Every time the packager changes the spec file, they have to make a commit to “save” the changes and do a build and the number in %autorelease will be incremented. When the Version is changed, the autorelease number is reset to 1.
The purpose of the git commit message is to summarize changes to the contents of the repository. The purpose of the %changelog section is to summarize changes to the package. The %autochangelog macro takes a git commit message, the author name, and the commit timestamp, and formats them in a way that is suitable for the %changelog section.
If Martin were to do another build, let’s say with a patch added, he would adjust the spec file adding a Patch line, and create a commit with:
$ git commit -a -m 'Add patch to fix rhbz#1000002'
The %autorelease field would be automatically increased by one, and the %autochangelog text would now start with:
* Thu Mar 23 2023 Martin Stránský <stransky@redhat.com>- 110.0-4
- Add patch to fix rhbz#1000002
What are the effects of the new workflow?
It is easiest to consider the effect for the users: no change. %autorelease and %autochangelog get replaced by “real” content before the package is built, and the binary package downloaded by users looks exactly the same.
For the packager, there is less busywork. The Release field is constant and the git commit text is reused for the changelog. I’ve glossed over the details here, but the git commit text can contain parts which are not included in the changelog text. It can even have commits that are completely elided from the changelog.
This automation also makes some mistakes less likely. For example:
The maintainer makes changes, but forgets to bump Release, and the build fails because a previous build with the same version-release already exists.
The maintainer makes changes, but forgets to describe them in %changelog, and users don’t know what changed.
The maintainer makes a changelog entry, but writes Tue instead of Thu, and rpm complains about an invalid date.
On the other hand, the packager has to be more disciplined. The text in the git commit message ends up visible to users. So it must be formatted accordingly. Every commit in git bumps the number in the release tag. The changelog is now formatted in the same specific style in all packages. Arguably, those are not huge limitations, but some adjustment of packager habits is required.
Using rpmautospec has a positive effect for external contributors. In Fedora, anyone who wants to contribute a change to the package is encouraged to open a pull request.
Unfortunately, for changes that touch the spec file, with traditional Release and %changelog, we have a conundrum. If the contributor does not update those in their commit, the maintainer has to do this before the build, and effectively the contribution is incomplete. If the contributor does update those in their commit, and the pull request is not merged immediately, it is likely that by the time it is merged the Release number will be out of date, the date in the %changelog will be in the past, and the spec file may even already have entries with later dates, and git will always show a merge conflict in the %changelog section.
With rpmautospec, all these problems go away. The release number is counted automatically. The date in the changelog is derived from the timestamp of when the patch was merged. And the changelog is generated from the stream of commits so there is no conflict to be had.
A specific variant of this contributor workflow occurs when the maintainer wants to copy (cherry-pick in git parlance) a commit to another branch. For example, because the important bugfix that was necessary in F38 also needs to be applied in F37, it is likely that, with rpmautospec, the commit can be applied without any changes to a different packaging branch.
Wrap-up
%autorelease and %autochangelog have been available for a while, but have now reached a level where they work nicely for common maintenance patterns and a great majority of packages; even if some some complicated corner cases are not yet supported. With Fedora 38, rpmautospec is now the recommended method. Hopefully, we will have happier maintainers and contributors with no negative changes noted by the users.
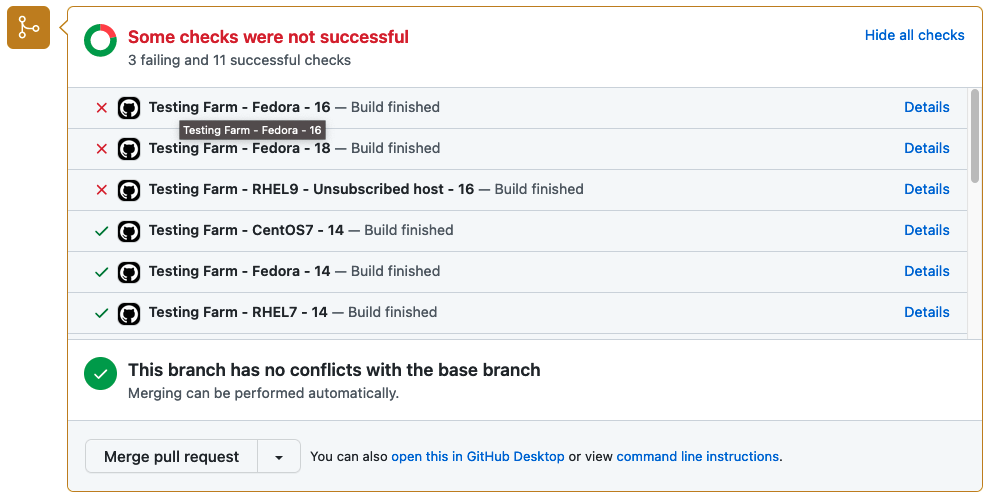
Every project on GitHub that’s destined for Red Hat Enterprise Linux (RHEL), Fedora Linux, CentOS 7, CentOS Stream 8, and CentOS Stream 9, should be tested before its changes are synced into a Git distribution repository (dist-git). It’s important to catch problems before delivering software to customers, and help quality assurance teams catch errors. We should implement Shift Left into our workflows process.
Introduction
Testing Farm is an open-source testing system offered as a service. Testing Farm’s idea is similar to Compile Farms, but with a focus on executing automated tests. Its mission is to provide a reliable and scalable service for executing automated tests from various users, such as Fedora CI, Packit, and others. The entry point for our users is an HTTP-based API. Testing Farm scales across many infrastructures, including private and public clouds. Using the composite testing-farm-as-a-github-action, currently available on the GitHub Marketplace, allows you to test your project efficiently.
GitHub Marketplace and advantages of publishing actions here
GitHub Marketplace is a place where developers can find, among other elements, all published GitHub Actions, in one place. Anyone is authorized to publish an action on the GitHub Marketplace.
An action, in order to be published, must reside in its own GitHub repository.
The advantage of publishing an action on the Marketplace, in addition to publishing it in a public GitHub repository, is the visibility of written actions for other users.
Testing Farm as GitHub Action
Testing-farm-as-a-github-action, shortly TFaGA, is a composite GitHub action, intended to be used from other GitHub Actions.
Its main purpose is scheduling tests on the Testing Farm infrastructure triggered by an event that occurs in a GitHub repository and, optionally, displaying the results of executed tests.
NOTE: It is important to have the tested code reviewed by an authorized person, like an owner or member, in order to avoid running malicious code on the Testing Farm infrastructure.
Any kind of test which can be described with a TMT plan, can be executed. The testing environment can be chosen from Fedora Linux, CentOS, including CentOS Stream, or RHEL. We need to test our software as soon as possible.
For whom is testing-farm-as-github-action intended
The TFaGA can be used by developers or maintainers, generally, anyone who wants to test a repository located on GitHub. Anyone who would like to add software to the distributions mentioned above should guarantee that it delivers working software. Customers love software that is working and tested.
Action inputs
TFaGA input is highly configurable but there only two inputs that are without default values and are required to be inserted by the user. These are:
The minimal example of using the TFaGA (on an already checkouted repository) will look similar to this:
- name: Schedule tests Testing Farm uses: sclorg/testing-farm-as-github-action@v1 with: api_key: ${{ secrets.TF_API_KEY }} git_url: <URL to a TMT plan>
All other input values are optional and have preassigned default values.
The inputs are divided into logical groups:
Testing Farm
contains options for configuring the testing farm itself. Configurable items can be the API key, URL to TF’s API, and the scope of the used TF – public, or private
TMT metadata
contains options for configuring the TMT specification, such as URL for the Git repository with the TMT plan, or regex for selecting the plan.
Test environment
contains options for configuring the operating system and architecture and where the test would be run. Supported Linux distributions are Fedora Linux, and CentOS, including CentOS Stream, RHEL7, and RHEL8. Moreover, the secrets and environment variables needed for the test execution can be specified with options belonging to this group.
Test artifacts
contains settings for additional artifacts to install in the test environment. For more information see Rest API documentation.
Miscellaneous
contains settings for various miscellaneous options, such as, whether the PR should be updated with test results after finishing the job or what should be written in it.
More information about the inputs can be found in the README.md.
Action outputs
TFaGA action provides, as output, a request_id and a request_url of a scheduled testing farm request. Combining request_url and request_id together, the user obtains a URL address pointing to a log artifactory. Test logs and test results are collected here in text form from the Testing Farm.
Optionally, if the event which triggers the Testing Farm action is related to a Pull Request, the user can enable a Pull Request status update. Enabling this option ensures that test results are summarized in a graphical form directly in the PR. An example of the graphical output is displayed in the picture below.
Status of tests delivered by Testing Farm as GitHub Action
How to use a Testing Farm as GitHub Action in your repository?
As TFaGA is a composite GitHub action, it is supposed to be embedded in other user-specified GitHub actions.
Example of action, triggered by commenting on a PR
The following example demonstrates, how the TFaGA can be used in a GitHub project. The whole example can be found in sclorg repositories.
NOTE: It is important to check the contents of the tested PR so that no malicious code will be run on the Testing Farm infrastructure. For this reason, only members and owners of the repository should be able to run the tests, as shown in the example below.
The test in this specific example would be triggered with a created comment on a PR by a member or owner of a specific repository. The comment has to include the string ‘[test]’.
name: upstream tests at Testing Farm
on: issue_comment: types:
Created
jobs: build: name: A job run on explicit user request run-ons: ubuntu-20.04 if: | github.event.issue.pull_request && contains(github.event.comment.body, '[test]') && contains(fromJson('["OWNER", "MEMBER"]'), github.event.comment.author_association)
Clone and checkout repository to a proper pull request branch:
- name: Checkout repo uses: actions/checkout@v2
The following shows scheduled tests on Testing Farm by the GitHub Action. This will pass to a testing-farm-as-a-github-action an api_key, stored in the repository secrets, the URL to a TMT plan, and the environment variables that are required by the triggered tests. The chosen testing OS is CentOS7.
Test results are, by default, displayed as a status directly within a Pull Request with GitHub statuses API.
Summary
Why use this GitHub action in your project? It will eliminate caring about testing the infrastructure environment, writing a lot of new GitHub Action workflows, and handling Pull Request statuses.
When using TFaGA, you get the whole testing infrastructure according to your needs simply by providing a TMT test plan and an API key. The pool of available testing environments is composed of many processor architectures and Linux distributions.
Your tests are triggered simply by an action you specify in the configuration file. Logs and results from test execution are collected, reported, and stored in text form and optionally also transparently displayed in the Pull Request status.
Your action is only to get the ‘api_key’ from the Testing Farm team and write a simple GitHub workflow to use our GitHub Action.
So let’s test project changes as soon as possible before the project goes out to the customers!
This article showcases rpmdistro-repoquery, and describes how to use it to simplify doing RPM-based package operations across multiple distributions. This does not require using SSH to log into another host or starting a container or VM.
Introduction
Whether you’re a packager, system administrator, or a user of Fedora Linux, CentOS Stream, or their derivatives (RHEL, AlmaLinux, Rocky Linux etc.), you might already be familiar with dnf repoquery. This tool allows you to query the repositories configured on the system for information about available packages, whether or not they are currently installed on the local machine.
This is great, within limits. For instance, on Fedora Linux, you can query packages built for stable and branched Fedora Linux releases and, if you install fedora-repos-rawhide, packages in the development branch. Sufficient care is required to make sure you don’t enable repos meant for different Fedora Linux releases by default and thus accidentally upgrade the running system.
Enter rpmdistro-repoquery: it comes with a set of repo definitions for different RPM-based distributions, but instead of putting them in /etc/yum.repos.d with the repositories meant for actual use, put them in /usr/share/rpmdistro-repoquery (or, if you so choose, you can clone the repository and use definitions that come in the checkout). DNF is then invoked with a custom configuration file and a custom cache location that points at one of the repos for one of the distributions rather than the default location.
The various supported distributions come with the relevant repositories enabled by default. Some have additional repositories that need to be enabled explicitly. For example, source repos are off by default. Also, CentOS Stream configurations come with additional repos for SIG packages that are off by default.
This opens up a lot of use cases. I highlight some of them below.
Note: The primary author of this tool, Neal Gompa, works on a lot of RPM-based Linux distributions. I became involved using it in ebranch.
Real-life rpmdistro-repoquery use cases
Quickly seeing if a CentOS Stream update has made it to the mirrors
In Fedora’s build system, updates go through Bodhi, and once they are marked testing or stable that means there is a compose containing those updates, and they tend to hit mirrors shortly after.
In CentOS Stream, the situation is more complicated, as the QA process is not visible to the public. Take clang for example: given a commit, and a matching Koji build on January 27th, can we be sure this is pushed out to the mirrors?
It turns out, as of February 9th, it’s not in the mirrors yet:
Comparing what is packaged in different distributions
Scenario: you use / manage a heterogeneous fleet of different distributions. You want to find out if all the packages you need are available (because you might need to package what’s missing).
Let’s see if myrepos is available on openSUSE Tumbleweed (the rolling distribution):
Searching by the Fedora Linux package name yields nothing, but in this case, searching by the binary shows a match (since those are in the RPM metadata): myrepos is available, but you’ll need a different package name in your configuration management.
ebranch
This is a special case of the former. ebranch is a tool for branching Fedora Linux packages for EPEL.
Given that CentOS Stream (and its downstreams, such as Red Hat Enterprise Linux, AlmaLinux and Rocky Linux) only carries the subset of Fedora Linux packages that Red Hat is committed to supporting, EPEL provides a way for the community to maintain additional packages built against RHEL (or CentOS Stream).
A major problem here is dealing with dependency hell: a missing package might have several missing dependencies, which in turn have more missing dependencies… Getting retsnoop in EPEL 9 involves branching 189 packages in total!
ebranch utilizes rpmdistro-repoquery to compare what is available in Rawhide (rpmdistro-repoquery fedora rawhide) with what is available in CentOS Stream + EPEL (rpmdistro-repoquery centos-stream-legacy 8 and rpmdistro-repoquery centos-stream 9) to build up a transitive closure of missing dependencies and report on any dependency loops. ebranch also computes a chain build order for the missing dependencies, grouping packages that can be built in parallel.
mkosi is a tool for generating OS images; currently it contains the logic for different distributions (e.g. Fedora, CentOS), but this makes it hard to, for example, build an image for CentOS SIGs such as Hyperscale.
With Daan De Meyer’s refactor rpmdistro-repoquery’s repo files can now be reused by mkosi so in the future, tailoring what repositories are used to build an OS image should be much easier.
Conclusion
The contributors for this tool have found it very useful in our Linux distribution work, and we hope this article can help introduce it to others who likewise find it useful.
Please try it yourself — on Fedora Linux, and on any CentOS Stream or derivatives with EPEL enabled, simply do:
$ sudo dnf install rpmdistro-repoquery
If the distro you want to work with is not supported, pull requests are welcome! Likewise with suggestions or requests. If you want to package rpmdistro-repoquery in a different distribution, feel free to use the Fedora packaging as reference.
In previous installments (Fedora 32, Fedora 35), there was a strong focus on making things work with Docker on Fedora Linux. This article will focus on the final stage of this long journey. It will focus on migrating a cross-platform production set-up from Docker to Podman.
Background
Docker and Podman use the same open standard for containers. On top of this container standard, there are multiple ways of organizing containers together. Docker-Compose and Kubernetes are the two main technologies for this, although tools like Ansible are also popular.
On the business side though, there are strong differences. Docker is distributed with a non-free application called Docker Desktop, while Podman historically never had a UI. Docker started live in 2013 and had its rise to prominence in 2016. Podman started in 2018 and it has only become more popular in the last two years.
Podman was certainly not the first on the scene, and it has been fighting an uphill battle. Still, in many ways, this has been an opportunity. Podman can avoid some of the architectural errors that Docker made, and it can integrate with other tools that didn’t exist yet when Docker started.
Personal background
The previous articles about Docker and Fedora are based on the author’s professional life. At the company were I work, we heavily relied on Docker when I came on board. This meant that I needed Docker, and I started to document my struggles which ultimately lead to the first article. The second article was a follow-up to inform readers that most hurdles from the past were no longer a problem.
Podman Destkop
The game-changer in this whole story is Podman Desktop. It is a cross-platform UI that allows teams on Linux, macOS and Windows to collaborate. It works the same way as Docker Desktop, including a bundled VM and WSL support. This also means that Podman now offers a complete package for software companies. While software developers on Linux could use Podman in the past, it’s now possible to migrate an entire team across environments!
Migrating Docker
So, let’s start migrating from Docker to Podman. First, you’ll need to make sure that you have podman and podman-compose installed. You can easily download Podman Desktop from Flathub.
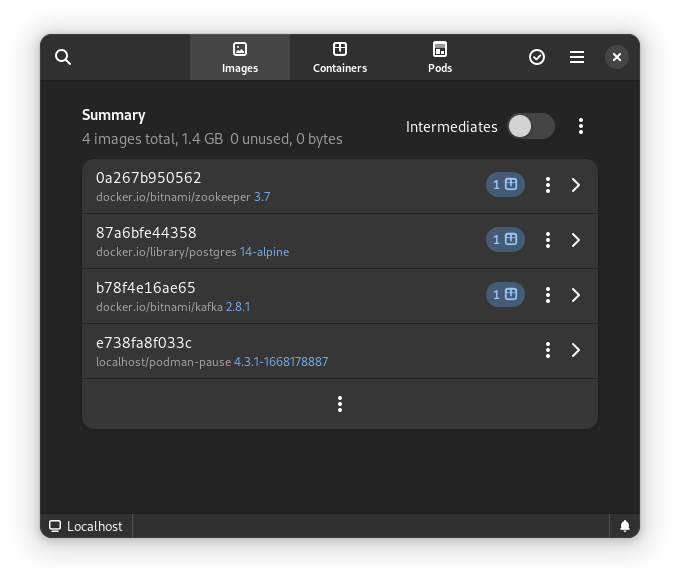
Image files
Image files are good as they are! They are identical because of the open standards behind containers.
One thing that you will see now is that there are a plethora of companies and groups that offer their own image-repositories.
hub.docker.com (alias, docker.io) is the offering from Docker, which their tooling conveniently defaults to.
registry.gitlab.com is the registry of GitLab’s commercial offering. Community editions follow this same syntax resulting in, for example: registry.gitlab.gnome.org
registry.fedoraproject.org is Fedora’s Registry. This registry is also used for flatpaks from the Fedora repository.
Quay.io is the offering from Red Hat, which contains all of Podman’s tooling, but also CentOS images.
The biggest change that you’ll have to adapt to, when switching from Docker to Podman, is that you’ll be encouraged to write full image addresses instead of just stubs: `postgres:14-alpine` becomes `docker.io/library/postgres:14-alpine`.
Docker-Compose files
Compose files are Docker specific and they can’t be used with Podman. What you can use, though, is podman-compose. Better yet, you can start your docker-based platform and then use Podman Desktop to export your current configuration to a Kubernetes file.
$ podman-compose -f ./docker-compose-platform.yaml up --detach
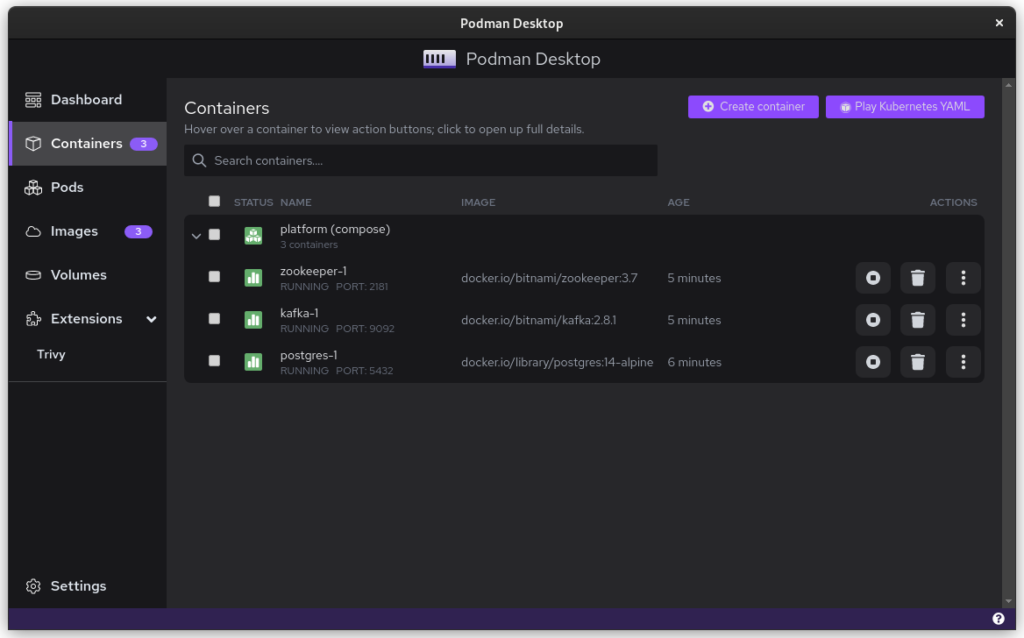
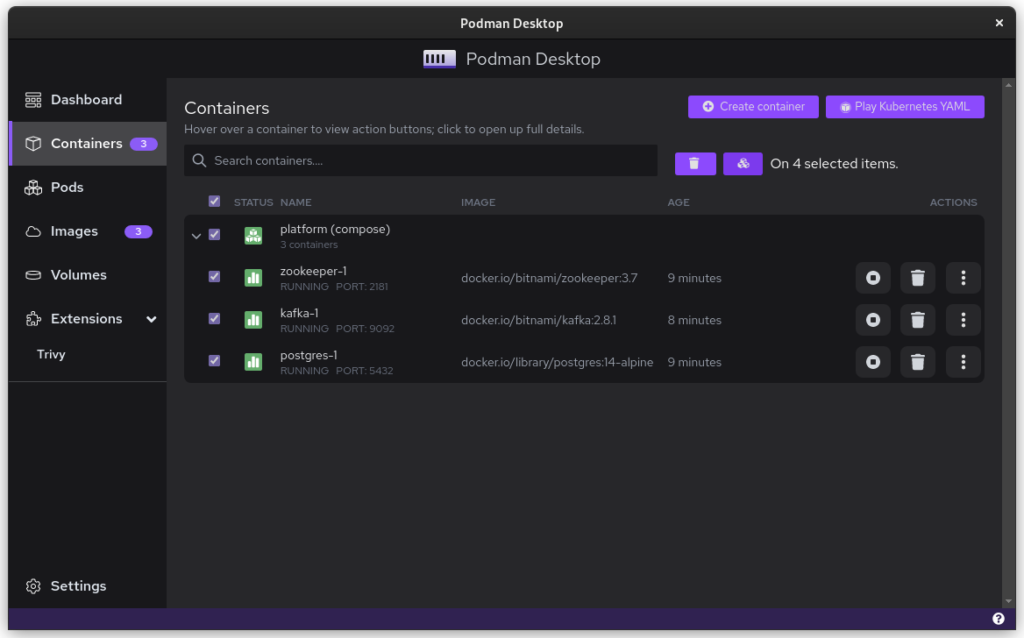
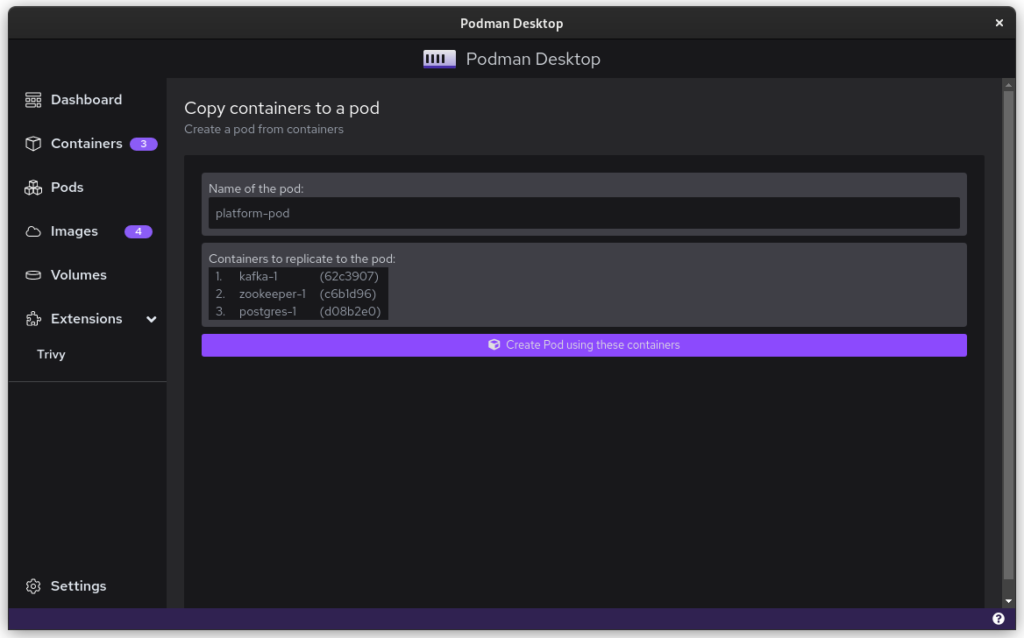
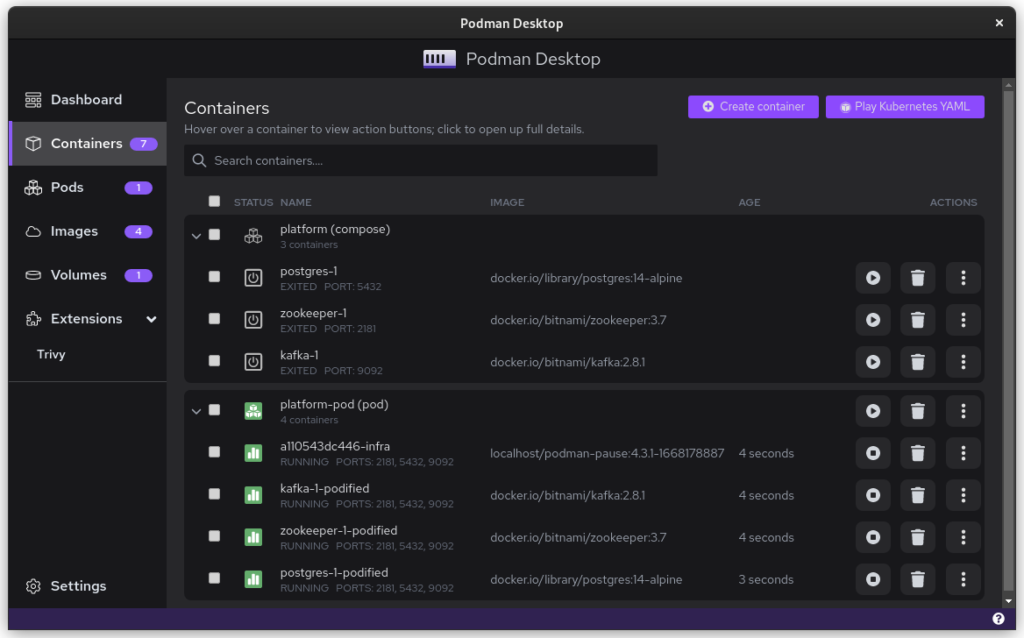
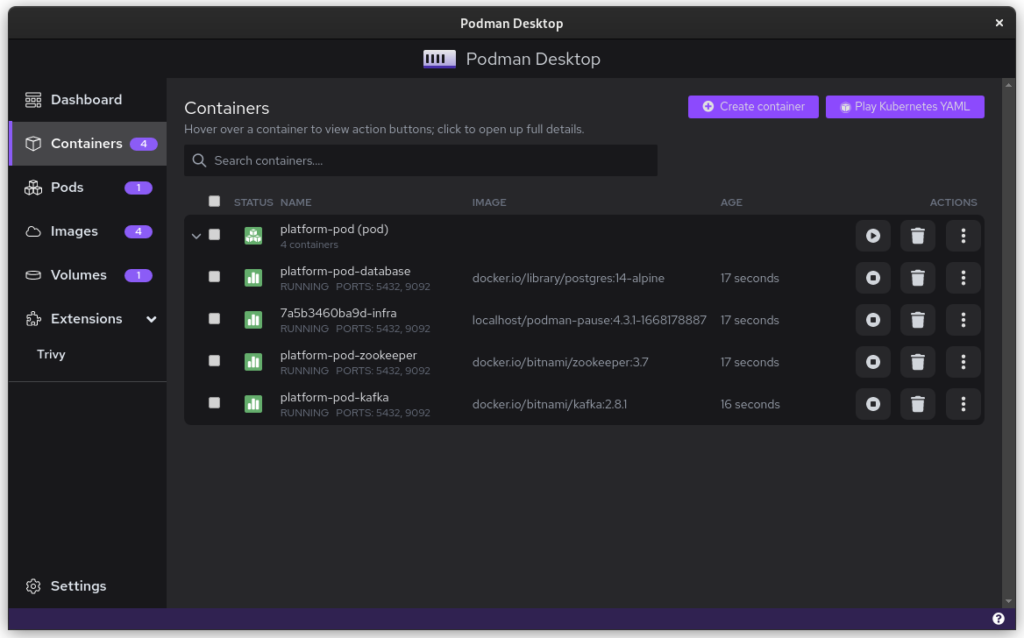
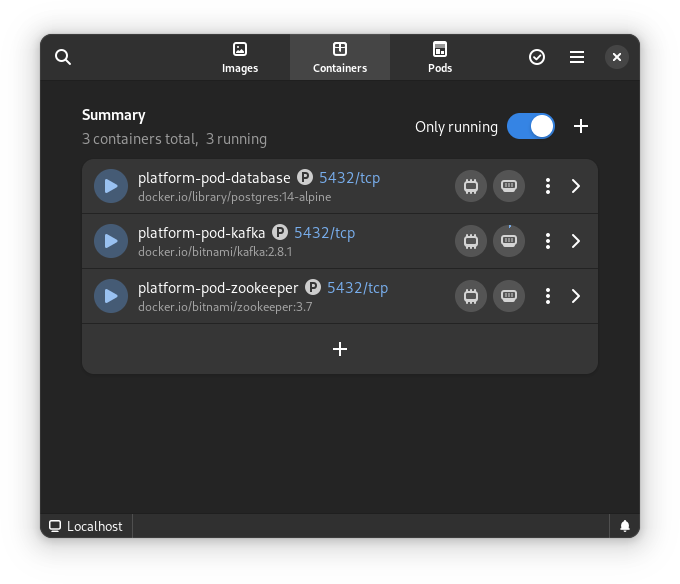
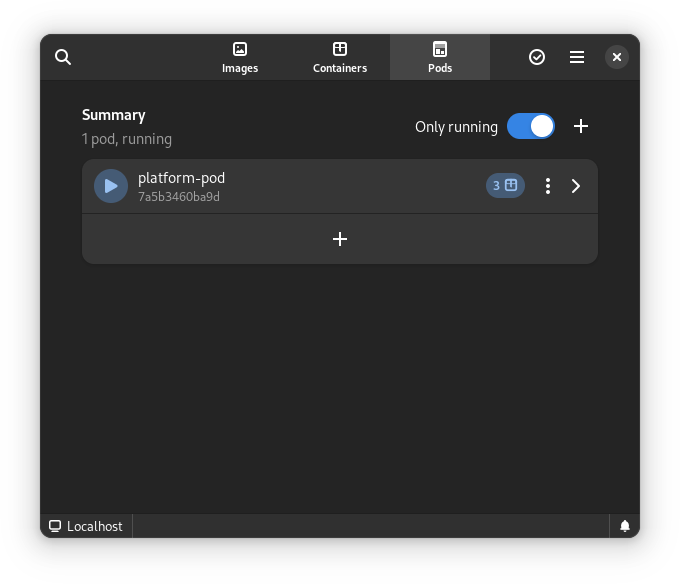
Once you start podman-compose with your old docker-compose .yaml file, you’ll see that you have a number of containers running in one ‘compose’ group. This is how things translate into the world of Podman. From here, you can select the containers and create a Pod. A Pod is a collection of containers that run in their own network.
Containers as started with `podman-compose`
Select all to creat a new pod
Name the pod
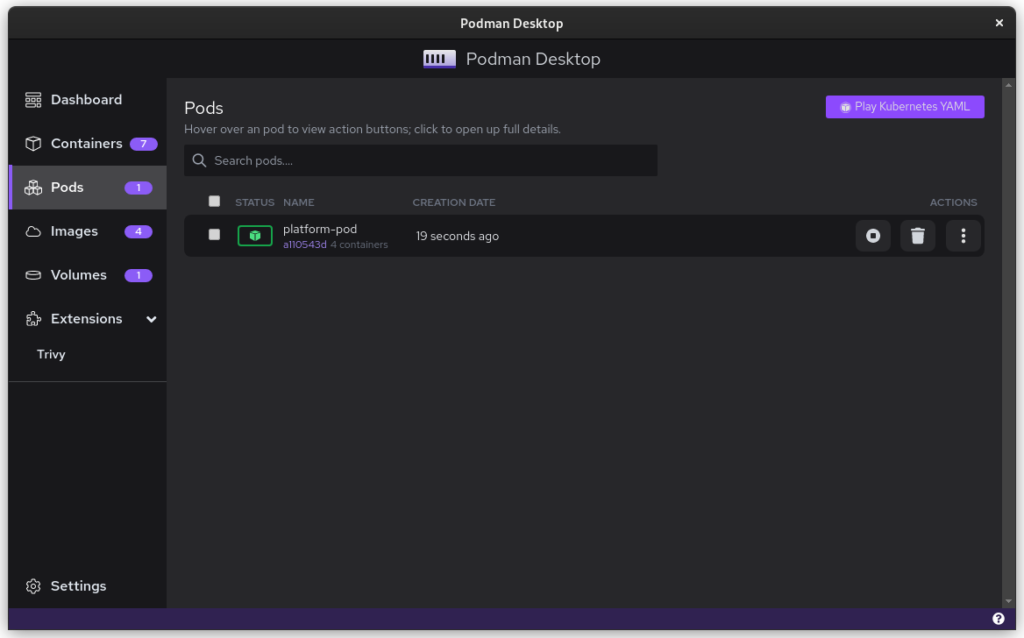
The pod replaced the podman-compose containers
There is a single pod
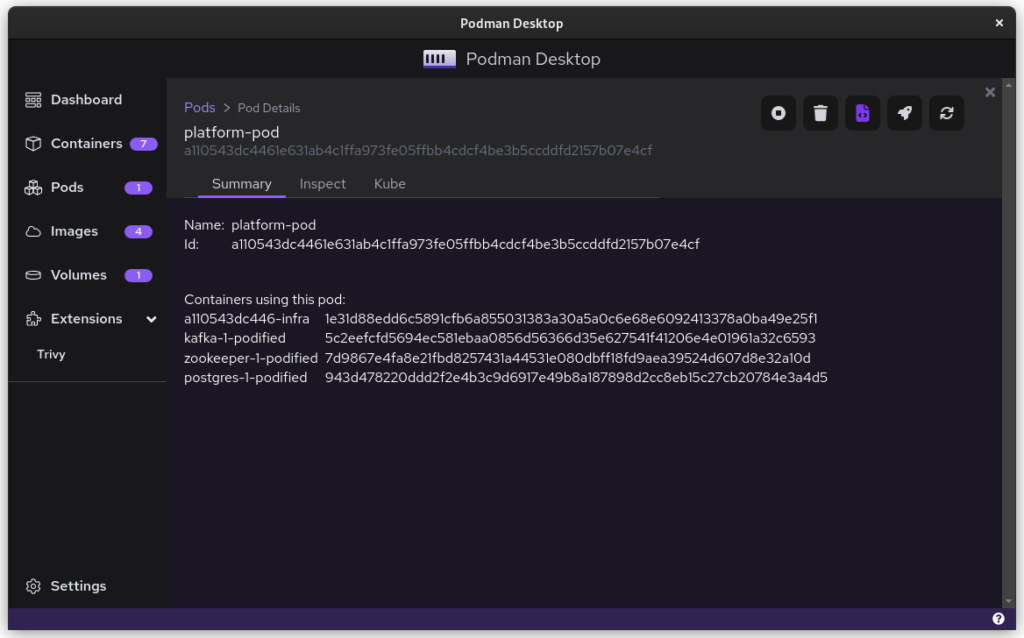
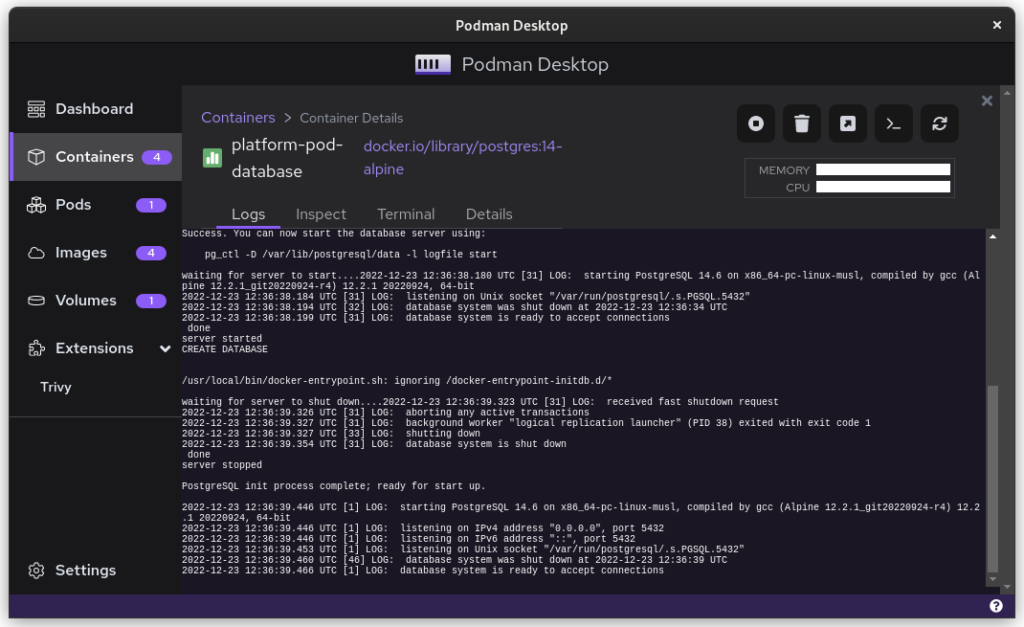
Logging relate to the pod
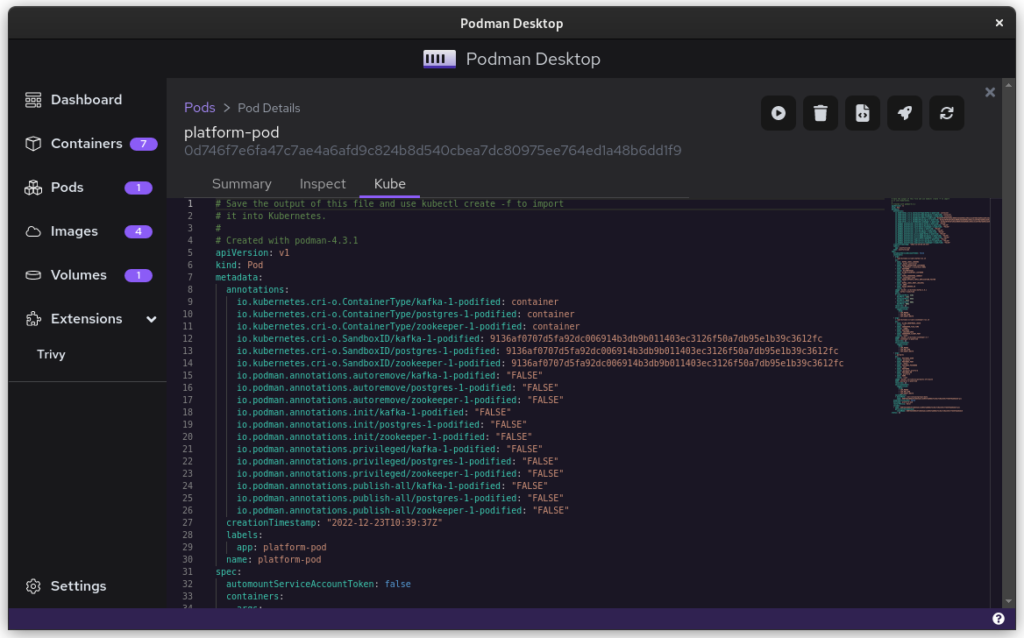
The Kube file to export
Once you inspect the Pod, you have a Kube file that represents this container collection. Save it somewhere and give it another critical look. You can likely remove some stuff without impacting the functioning of the system. After all, auto-generated documents will have some artifacts.
All three files from the demonstration can be seen here:
That’s it. You have now migrated from Docker to Podman. To start up Podman with the Kubernetes file simply do:
$ podman play kube podman-kube-platform-cleanup.yaml --replace
GitLab CI/CD
GitLab has a great set of open source and commercial offerings that allow you to automatically deploy and test your system. In the past, people working with Docker inside GitLab had to resort to a Docker-in-Docker solution. That gives many engineers headaches. A migration from Docker to Podman will resolve that problem.
For example, you can use Podman’s official image to easily build your own product image:
In this example we use the official Podman stable image based on Fedora Linux 37. We use that to build the latest version of our platform based on the ./distribute/image file. We can do this all without ever having to set up Docker.
Tooling and integrations
Finally, we have to talk about certain tooling. Not all tooling will work equally well from the start. For example, the login that Amazon’s AWS CLI provides is hardcoded for Docker. Still, you can easily login to AWS by doing this:
Perhaps all of this sounds good, but you need more time to convince your team and company that embracing open source tools is great. In that case, you can add the following snippet to .bashrc and use Podman without changing the tooling of your team.
#Ensure that these aliases also affect other scripts
shopt -s expand_aliases alias docker=podman
alias docker-compose=podman-compose
This also offers you a chance to test the set-up that you have, in case of technical incompatibilities. You can also use the package podman-docker (available via dnf) to automatically convert Docker commands into Podman commands.
Company experience
The migration from Docker to Podman has been well received within my development team. The desktop experience for macOS and Windows users has improved since they no longer have to struggle with a tool that is closed source. The improvements to the CI system also help in maintaining the pipeline and it makes the integration tests run faster.
In day to day work, the team is really enthusiastic about the ease with which they can inspect running containers, manage images, and clean temporary volumes.
In the big picture, the migration from Docker to Podman further aids the company in limiting financial liabilities. Developers on macOS and Windows are no longer dependent on a closed-source product. Finally, it also means that the team gets some experience in Kubernetes, which will certainly pay off in the future.
Summary
The gains from switching to Podman really outweigh the bit of time it takes to set up and to migrate. The future is bright for Podman and Podman Desktop, and it offers a great solution to the problems that come with Docker.
Finally, for us Fedora Linux users, there is another great benefit. There is some beautiful tooling in development that can make our lives so much easier. The following screenshots are of the application Pods. This is currently in active development but will certainly prove to be a useful tool in the future.
This article has been made possible by my employer, Bold Security Technologies. Got your own migration stories to share? Let us know in the comments.
We are excited to announce the first public preview image of the new Anaconda web interface! Our vision is to reimagine and modernize our installer’s user experience (see our blog post “Anaconda is getting a new suit”). We are doing this by redesigning the user experience on all fronts to make it more easy and approachable for everyone to use.
Today, we would like to introduce our plans for the public preview release, as our new project has already reached a point where core code functionality is already developed and the new interface can be used for real installations.
So, we’re giving you something to play with!
Why public preview image?
By giving you a working ISO as soon as we can, you have the opportunity to help us to define this new UI. This task allows us to rethink what we have and find new ways to overcome the challenges of the UI instead of re-creating what we had already. Please take this opportunity and reach us with your feedback to help us to create the best OS installer ever!
Please let us know what you require from Anaconda. What featuresare important to you and why are these important? That will allow us to prioritize our focus on development and design. See below for how to contact us.
Thanks a lot to the Image Builder team for providing us with a way to build ISO with the Fedora 37 Workstation GA content. We are planning to provide additional images with an updated installer to give you the newest features and fixes with the link above. There are no updates to the installation payload (installed system data) yet. We will announce important updates of the ISO image by sending mail to anaconda-devel@lists.fedoraproject.org with CC to devel@lists.fedoraproject.org. Please subscribe to either of these to get information about the news. This way we will be able to iterate on your feedback.
What you will get with the preview ISO
The ISO will allow you to install the system and let you get a taste of the new UI, so you can provide us early feedback. However, it is pretty early in the development cycle. We advise you to not use this ISO to install critical infrastructure or machines where you have important data.
Let’s go to the more interesting part of what you can do with the ISO:
Choose installation language
Select your disks
Automatically partition the disks. BEWARE! This will erase everything on the selected disks.
Automatically install Fedora 37 GA Workstation system
Basic review screen of your selections
Installation progress screen
Built-in help (on Installation destination screen only)
Known issues:
In the bootloader menu you’ll see “Install Fedora 38”, it’s expected because the installation environment is from Rawhide. However, the content installed will be Fedora 37 GA, so don’t worry.
Virtual Box on Mac might have resolution issues. We are working on resolving this issue.
Aspect ratio and window handling. We know we need to solve this better, feedback is welcome.
How to provide feedback?
Your feedback is critical to have a project which you and we can be proud of, so please share it with us. To give us feedback:
Please take your time to play with the UI and tell us what you think. What works great, what is not working and what you would like to have. Ideally, follow future updates and tell us if the situation is better or worse.
We are really counting on your feedback and we are thankful to have you all supporting us in this journey!
Nowadays, the number of devices is getting bigger and bigger, and modern operating systems must try to support all types and several of them with every integration, with every release. Maintaining a large number of devices is difficult, expensive and also hard to test, specially for plug-and-play devices, like USB devices.
Therefore, it is necessary to create a mechanism to facilitate the maintenance and testing of old and new USB devices. And this is where USB device emulation comes in. In that way, a complete framework including a big bunch of emulated and validated USB devices will allow easier integration and release. The area of application would be very wide: earlier bug search/detection even during development, automatic tests, continuous integration, etc.
How to emulate USB devices
USB/IP project allows sharing the USB devices connected to a local machine so that they can be managed by another machine connected to the network by means of a TCP/IP connection.
Then USB/IP project consists of two parts:
local device support (host) to allow remote access to every necessary control events and data
remote control that catches every necessary control event and data to process like a normal driver
The procedure is valid for Linux and Windows, here I will focus only on Linux.
The idea behind emulation is to replace the remote device support with an application that behaves in the same way. In this way we can emulate devices with software applications that follow the commented USB/IP protocol specification.
In the following points I will describe how to configure and run the remote support and how to connect to our USB emulated device.
Remote support
Remote support is divided in two parts:
kernel space to control a remote device as it was local, that is, to be probed by the normal driver.
user space application to configure access to remote devices.
At this point, it is important to remark that the device emulators, after configuration by user space application, will communicate directly with the kernel space.
Local support has a very similar structure, but the focus of this article is device emulation.
Let’s analyze every part of remote support.
Kernel space
First of all, in order to get the functionality we need to compile the Linux Kernel with the following options:
CONFIG_USBIP_CORE=m
CONFIG_USBIP_VHCI_HCD=m
These options enable the USB/IP virtual host controller driver, which is run on the remote machine.
Normal USB drivers need to be also included because they will be probed and configured in the same way from virtual host controller drivers.
Besides there are other important configuration options:
These options define the number of ports per USB/IP virtual host controller and the number of USB/IP virtual host controllers as if adding physical host controllers. These are the default values if CONFIG_USBIP_VHCI_HCD is enabled, increase if necessary.
The commented options and kernel modules are already included in some Linux distributions like Fedora Linux.
Let’s see an example of available virtual USB buses and ports that we will use later.
Default and real resources in example equipment:
$ lsusb
Bus 002 Device 001: ID 1d6b:0003 Linux Foundation 3.0 root hub
Bus 001 Device 002: ID 0627:0001 Adomax Technology Co., Ltd
Bus 001 Device 001: ID 1d6b:0002 Linux Foundation 2.0 root hub
$ lsusb -t
/: Bus 02.Port 1: Dev 1, Class=root_hub, Driver=xhci_hcd/15p, 5000M
/: Bus 01.Port 1: Dev 1, Class=root_hub, Driver=xhci_hcd/15p, 480M
|__ Port 1: Dev 2, If 0, Class=Human Interface Device, Driver=usbhid, 480M
$
Now, we will load the module vhci-hcd into the system (default configuration for CONFIG_USBIP_VHCI_HC_PORTS and CONFIG_USBIP_VHCI_NR_HCS):
$ sudo modprobe vhci-hcd
$ lsusb
Bus 004 Device 001: ID 1d6b:0003 Linux Foundation 3.0 root hub
Bus 003 Device 001: ID 1d6b:0002 Linux Foundation 2.0 root hub
Bus 002 Device 001: ID 1d6b:0003 Linux Foundation 3.0 root hub
Bus 001 Device 002: ID 0627:0001 Adomax Technology Co., Ltd
Bus 001 Device 001: ID 1d6b:0002 Linux Foundation 2.0 root hub
$ lsusb -t
/: Bus 04.Port 1: Dev 1, Class=root_hub, Driver=vhci_hcd/8p, 5000M
/: Bus 03.Port 1: Dev 1, Class=root_hub, Driver=vhci_hcd/8p, 480M
/: Bus 02.Port 1: Dev 1, Class=root_hub, Driver=xhci_hcd/15p, 5000M
/: Bus 01.Port 1: Dev 1, Class=root_hub, Driver=xhci_hcd/15p, 480M
|__ Port 1: Dev 2, If 0, Class=Human Interface Device, Driver=usbhid, 480M
$
The remote USB/IP virtual host controller driver will only use the configured virtualized resources. Of course, emulated devices will work in the same way.
User space
The other necessary part in the USB/IP project is the user space tool usbip and needs to be used to configure the referred kernel space on both sides, although, in the same way, we only focus on the remote side, since the local side will be represented by the emulator.
That is, usbip tool will configure the USB/IP virtual controller (tcp client) in kernel space to connect to the device emulator (tcp server) in order to establish a direct connection between them for USB configuration, events, data, etc. exchange.
The tool is independent of the type of device and is able to provide information about available and reserved resources (see more information in the examples below).
The local USB/IP virtual host controller needs to specify the pair bus-port that will used for remote access, it will be the same for emulated devices, but in this case, this pair can be anything because there is no real device and resource reservation is not necessary.
This tool is found on the Linux Kernel repository in order to be totally synchronized with it.
Location of the tool on the Linux Kernel repository: ./tools/usb/usbip
In some distribution like Fedora Linux, the usbip utility can be installed by means of usbip package from repositories. If usbip utility or related package can not be found, follow the instruction in the available README file to compile and install. Suitable rpm package can also be generated from the usbip-emulatorrepository:
$ git clone https://github.com/jtornosm/USBIP-Virtual-USB-Device.git $ cd USBIP-Virtual-USB-Device/usbip $ make rpm ...
$
How to emulate USB devices
Emulators are generated in Python and C. I have started with C development (I will focus on this part), but the same could be done in Python.
For C development, compile emulation tools from the usbip-emulatorrepository:
$ git clone https://github.com/jtornosm/USBIP-Virtual-USB-Device.git $ cd USBIP-Virtual-USB-Device/c $ make ...
$
All the supported devices emulated at this moment will be generated:
hid-keyboard
hid-mouse
cdc-adm
hso
cdc-ether
bt
rpm package (usbip-emulator) can be also generated with:
$ make rpm ...
$
As examples, Vendor and Product IDs are hardcoded in the code.
Following three examples to show how emulation works. We are using the same equipment for the emulator and remote USB/IP but they could run in different equipment. Besides, we are reserving different resources so all the devices could be emulated at the same time.
Example 1: hso
From one terminal, let’s emulate the hso device:
(“1-1” is the pair bus-port for the USB device on the local machine, as we are emulating, it could be anything. It is only important because usbip tool will have to use the same name to request the emulated device)
(As we saw previously, for this example machine, bus 3 is virtualized)
$ ip addr show dev hso
0 3: hso0: <POINTOPOINT,MULTICAST,NOARP> mtu 1486 qdisc noop state DOWN group default qlen 10 link/none $ rfkill list 0: hso-0: Wireless WAN Soft blocked: no Hard blocked: no ...
$ lsusb ... Bus 003 Device 002: ID 0af0:6711 Option GlobeTrotter Express 7.2 v2 ... $ lsusb -t ...
/: Bus 03.Port 1: Dev 1, Class=root_hub, Driver=vhci_hcd/8p, 480M |__ Port 1: Dev 2, If 0, Class=Vendor Specific Class, Driver=hso, 12M ...
$
In order to release resources:
$ sudo usbip port
Imported USB devices
====================
Port 00: <Port in Use> at Full Speed(12Mbps)
Option : GlobeTrotter Express 7.2 v2 (0af0:6711)
3-1 -> usbip://127.0.0.1:3241/1-1
-> remote bus/dev 001/002
$ sudo usbip detach -p 00
usbip: info: Port 0 is now detached!
$
And we can check that the device is released:
$ ip addr show dev hso0 Device "hso0" does not exist. $ rfkill list ...
$ lsusb ... $
After this, we can emulate again or stop the emulated device from the first terminal (i.e. with Ctrl-C).
Example 2: cdc-ether
From one terminal, let’s emulate the cdc-ether device (root permission is required because raw socket needs to bind to specified interface for data plane):
(“1-1” is the pair bus-port for the USB device on the local machine, as we are emulating, it could be anything. It is only important because usbip tool will have to use the same name to request the emulated device)
(As we saw previously, for this example machine, bus 3 is virtualized)
$ ip addr show dev eth0 4: eth0: <BROADCAST,MULTICAST,UP,LOWER_UP> mtu 1500 qdisc fq_codel state UNKNOWN group default qlen 1000 link/ether 88:00:66:99:5b:aa brd ff:ff:ff:ff:ff:ff $ sudo ethtool eth0 ...
Link detected: yes $ lsusb ... Bus 003 Device 003: ID 0fe6:9900 ICS Advent ... $ lsusb -t ...
/: Bus 03.Port 1: Dev 1, Class=root_hub, Driver=vhci_hcd/8p, 480M |__ Port 2: Dev 3, If 0, Class=Communications, Driver=cdc_ether, 480M |__ Port 2: Dev 3, If 1, Class=CDC Data, Driver=cdc_ether, 480M ...
$
For this example, we can also test the data plane.
(IP forwarding is disabled in both sides)
First, we can configure the IP address in the emulated device:
$ sudo ip addr add 10.0.0.1/24 dev eth0
$ ip addr show dev eth0
4: eth0: <BROADCAST,MULTICAST,UP,LOWER_UP> mtu 1500 qdisc fq_codel state UNKNOWN group default qlen 1000
link/ether 88:00:66:99:5b:aa brd ff:ff:ff:ff:ff:ff
inet 10.0.0.1/24 scope global eth0
valid_lft forever preferred_lft forever
$
Second, for example, from other directly Ethernet connected machine (real or virtual) we can configure a macvlan interface in the same subnet to send/receive traffic (ping, iperf, etc.):
$ sudo ip link add macvlan0 link enp1s0 type macvlan mode bridge $ sudo ip addr add 10.0.0.2/24 dev macvlan0 $ sudo ip link set macvlan0 up $ ip addr show dev macvlan0 3: macvlan0@enp1s0: <BROADCAST,MULTICAST,UP,LOWER_UP> mtu 1500 qdisc noqueue state UP group default qlen 1000 link/ether d6:f1:cd:f1:cc:02 brd ff:ff:ff:ff:ff:ff inet 10.0.0.2/24 scope global macvlan0 valid_lft forever preferred_lft forever inet6 fe80::d4f1:cdff:fef1:cc02/64 scope link valid_lft forever preferred_lft forever $ ping 10.0.0.1 PING 10.0.0.1 (10.0.0.1) 56(84) bytes of data. 64 bytes from 10.0.0.1: icmp_seq=1 ttl=64 time=55.6 ms 64 bytes from 10.0.0.1: icmp_seq=2 ttl=64 time=2.19 ms 64 bytes from 10.0.0.1: icmp_seq=3 ttl=64 time=1.74 ms 64 bytes from 10.0.0.1: icmp_seq=4 ttl=64 time=1.76 ms 64 bytes from 10.0.0.1: icmp_seq=5 ttl=64 time=1.93 ms 64 bytes from 10.0.0.1: icmp_seq=6 ttl=64 time=1.65 ms ...
In order to release resources:
$ sudo usbip port Imported USB devices ==================== ...
Port 01: <Port in Use> at High Speed(480Mbps) ICS Advent : unknown product (0fe6:9900) 3-2 -> usbip://127.0.0.1:3245/1-1 -> remote bus/dev 001/003 $ sudo usbip detach -p 01 usbip: info: Port 1 is now detached! $
And we can check that the device is released:
$ ip addr show dev eth0
Device "eth0" does not exist.
$ lsusb
...
$
And of course, traffic from the other machine is not working:
From 10.0.0.2 icmp_seq=167 Destination Host Unreachable From 10.0.0.2 icmp_seq=168 Destination Host Unreachable From 10.0.0.2 icmp_seq=169 Destination Host Unreachable From 10.0.0.2 icmp_seq=170 Destination Host Unreachable ...
After this, we can emulate again or stop the emulated device from the first terminal (i.e. with Ctrl-C).
Example 3: bt
From one terminal, let’s emulate the Bluetooth device:
(“1-1” is the pair bus-port for the USB device on the local machine, as we are emulating, it could be anything. It is only important because usbip tool will have to use the same name to request the emulated device)
(As we saw previously, for this example machine, bus 3 is virtualized)
$ hciconfig -a hci0: Type: Primary Bus: USB BD Address: AA:BB:CC:DD:EE:11 ACL MTU: 310:10 SCO MTU: 64:8 UP RUNNING PSCAN ISCAN INQUIRY RX bytes:1451 acl:0 sco:0 events:80 errors:0 TX bytes:1115 acl:0 sco:0 commands:73 errors:0 Features: 0xff 0xff 0x8f 0xfe 0xdb 0xff 0x5b 0x87 Packet type: DM1 DM3 DM5 DH1 DH3 DH5 HV1 HV2 HV3 Link policy: RSWITCH HOLD SNIFF PARK Link mode: SLAVE ACCEPT Name: 'BT USB TEST - CSR8510 A10' Class: 0x000000 Service Classes: Unspecified Device Class: Miscellaneous, HCI Version: 4.0 (0x6) Revision: 0x22bb LMP Version: 3.0 (0x5) Subversion: 0x22bb Manufacturer: Cambridge Silicon Radio (10) $ rfkill list ...
1: hci0: Bluetooth Soft blocked: no Hard blocked: no $ lsusb ...
Bus 003 Device 004: ID 0a12:0001 Cambridge Silicon Radio, Ltd Bluetooth Dongle (HCI mode) ...
$ lsusb -t ...
/: Bus 03.Port 1: Dev 1, Class=root_hub, Driver=vhci_hcd/8p, 480M |__ Port 3: Dev 4, If 0, Class=Wireless, Driver=btusb, 12M |__ Port 3: Dev 4, If 1, Class=Wireless, Driver=btusb, 12M ...
$
And we can turn off and turn on the emulated Bluetooth device, detecting several fake Bluetooth devices:
(At this moment, fake Bluetooth devices are not emulated/simulated so we can not set up)
Turn Bluetooth offTurn Bluetooth on
In order to release resources:
$ sudo usbip port Imported USB devices ==================== ...
Port 02: <Port in Use> at Full Speed(12Mbps) Cambridge Silicon Radio, Ltd : Bluetooth Dongle (HCI mode) (0a12:0001) 3-3 -> usbip://127.0.0.1:3243/1-1 -> remote bus/dev 001/002 $ sudo usbip detach -p 02 usbip: info: Port 2 is now detached! $
And we can check that the device is released:
$ hciconfig $ rfkill list ...
$ lsusb ... $
And of course, device is not detected (as before emulation):
Bluetooth is not found
After this, we can emulate again or stop the emulated device from the first terminal (i.e. with Ctrl-C).
Emulated vs real USB devices
When the real hardware and/or final device is not used to test, we can always feel insecure about the results, and this is the biggest hurdle that we will have to overcome to check the correct operation of the devices by means of emulation.
So, in order to be confident, emulation must be as close as possible to the real hardware and in order to get the most real emulation every aspect of the device must be covered (or at least the necessary ones if they are not related with other aspects). In fact, for a correct test, we must not modify the driver, that is, we must only emulate the physical layer, so that the driver is not able to know if the device is real or emulated.
Starting to test with the real hardware device is a very good idea to get a reference to build the emulator with the same features. For the case of USB devices, the device emulator building is easier because of the existing procedure to get remote control that complies with all the characteristics mentioned above.
Conclusion
USB device emulation is the best way to integrate and test the related features in an efficient, automatic and easy way. But, in order to be confident about the emulation procedure, device emulators need to be previously validated to confirm that they work in the same way as real hardware.
Of course, the USB device emulator is not the same as the real hardware device, but the commented method, thanks to the tested procedure to get remote control of the device, it’s very close to the real scenario and can help a lot to improve our release and testing processes.
Finally, I would like to comment that one of the best advantages of using software emulators is that we will be able to cause specific behaviors, in a simple way, that would be very difficult to reproduce with real hardware, and this could help to find issues and be more robust.
MLCube is a new open source container based infrastructure specification introduced to enable reproducibility in Python based machine learning workflows. It can utilize tools such as Podman, Singularity and Docker. Execution on remote platforms is also supported. One of the chairs of the MLCommons Best Practices working group that is developing MLCube is Diane Feddema from Red Hat. This introductory article explains how to run the hello world MLCube example using Podman on Fedora Linux.
Yazan Monshed has written a very helpful introduction to Podman on Fedora which gives more details on some of the steps used here.
Then, following the documentation, setup a virtual environment and get the example code. To ensure reproducibility, use a specific commit as the project is being actively improved.
Now change the runner command from docker to podman by editing the file $HOME/mlcube.yaml so that the line
docker: docker
becomes
docker: podman
If you are on a computer with x86_64 architecture, you can get the container using
mlcube configure --mlcube=. --platform=docker
You will see a number of options
? Please select an image: ▸ registry.fedoraproject.org/mlcommons/hello_world:0.0.1 registry.access.redhat.com/mlcommons/hello_world:0.0.1 docker.io/mlcommons/hello_world:0.0.1 quay.io/mlcommons/hello_world:0.0.1
Choose docker.io/mlcommons/hello_world:0.0.1 to obtain the container.
If you are not on a computer with x86_64 architecture, you will need to build the container. Change the file $HOME/mlcube.yaml so that the line
build_strategy: pull
becomes
build_strategy: auto
and then build the container using
mlcube configure --mlcube=. --platform=docker
To run the tests, you may need to set SELinux permissions in the directories appropriately. You can check that SELinux is enabled by typing
sudo sestatus
which should give you output similar to
SELinux status: enabled
...
Josphat Mutai, Christopher Smart and Daniel Walsh explain that you need to be careful in setting appropriate SELinux policies for files used by containers. Here, you will allow the container to read and write to the workspace directory.
mlcube run --mlcube=. --task=hello --platform=docker
mlcube run --mlcube=. --task=bye --platform=docker
Finally, check that the output
cat workspace/chats/chat_with_alice.txt
has text similar to
Hi, Alice! Nice to meet you.
Bye, Alice! It was great talking to you.
You can create your own MLCube as described here. Contributions to the MLCube examples repository are welcome. Udica is a new project that promises more fine grained SELinux policy controls for containers that are easy for system administrators to apply. Active development of these projects is ongoing. Testing and providing feedback on them would help make secure data management on systems with SELinux easier and more effective.
So what is Mutiny? Mutiny allows streaming of objects in an event driven flow. The stream might originate from a local process or something remote like a database. Mutiny streaming is accomplished by either a Uni or a Multi object. We are using the Uni to stream one object — a List containing many integers. A subscribe pattern initiates the stream.
A traditional program is executed and results are returned before continuing. Mutiny can easily support non-blocking code to run processes concurrently. RxJava, ReactiveX and even native Java are alternatives. Mutiny is easy to use (the exposed API is minimal) and it is the default in many of the Quarkus extensions. The two extensions used are quarkus-mutiny and quarkus-vertx. Vert.x is the underlying framework wrapped by Quarkus. The Promise classes are supplied by quarkus-vertx. A promise returns a Uni stream when the process is complete. To get started, install a Java JDK and Maven.
Bootstrap
The minimum requirement is either Java-11 or Java-17 with Maven.
With Java-11:
$ sudo dnf install -y java-11-openjdk-devel maven
With Java-17:
$ sudo dnf install -y java-17-openjdk-devel maven
BootstrapQuarkusand Mutiny with the Maven call below. The extension quarkus-vertx is not included to demonstrate how to add additional extensions. Locate an appropriate directory before executing. The directory mutiny-demo will be created with the initial application.
TheclassName entry on the Quarkus bootstrap is org.demo.mag.Startup which creates the file src/main/java/org/demo/map/Startup.java. Replace the contents with the following code:
package org.demo.mag; import java.util.List;
import java.util.concurrent.ExecutionException;
import java.util.function.IntSupplier;
import java.util.stream.Collectors;
import java.util.stream.IntStream; import io.quarkus.runtime.Quarkus;
import io.quarkus.runtime.QuarkusApplication;
import io.quarkus.runtime.annotations.QuarkusMain;
import io.smallrye.mutiny.Uni;
import io.smallrye.mutiny.tuples.Tuple2;
import io.vertx.mutiny.core.Promise; @QuarkusMain
public class Startup implements QuarkusApplication { public static void main(String... args) { Quarkus.run(Startup.class, args); } @Override public int run(String... args) throws InterruptedException, ExecutionException { final Promise<String> finalMessage = Promise.promise(); final String elapsedTime = "Elapsed time for asynchronous method: %d milliseconds"; final int[] syncResults = {0}; Application.runTraditionalMethod(); final Long millis = System.currentTimeMillis(); Promise<List<Integer>> promiseRange = Application.getRange(115000); Promise<Tuple2<Promise<List<Integer>>, Promise<List<Integer>>>> promiseCombined = Application.getCombined(10000, 15000); Promise<List<Integer>> promiseReverse = Application.getReverse(24000); /* * Retrieve the Uni stream and on the complete event obtain the List<Integer> */ promiseRange.future().onItem().invoke(list -> { System.out.println("Primes Range: " + list.size()); if(syncResults[0] == 1) { finalMessage.complete(String.format(elapsedTime, System.currentTimeMillis() - millis)); } { syncResults[0] = 2; } return; }).subscribeAsCompletionStage(); promiseReverse.future().onItem().invoke(list -> { System.out.println("Primes Reverse: " + list.size()); return; }).subscribeAsCompletionStage(); /* * Notice that this finishes before the other two prime generators(smaller lists). */ promiseCombined.future().onItem().invoke(p -> { /* * Notice that "Combined Range" displays first */ p.getItem2().future().invoke(reverse -> { System.out.println("Combined Reverse: " + reverse.size()); return; }).subscribeAsCompletionStage(); p.getItem1().future().invoke(range -> { System.out.println("Combined Range: " + range.size()); /* * Nesting promises to get multple results together */ p.getItem2().future().invoke(reverse -> { System.out.println(String.format("Asserting that expected primes are equal: %d -- %d", range.get(0), reverse.get(reverse.size() - 1))); assert range.get(0) == reverse.get(reverse.size() - 1) : "Generated primes incorrect"; if(syncResults[0] == 2) { finalMessage.complete(String.format(elapsedTime, System.currentTimeMillis() - millis)); } else { syncResults[0] = 1; } return; }).subscribeAsCompletionStage(); return; }).subscribeAsCompletionStage(); return; }).subscribeAsCompletionStage(); // Note: on very fast machines this may not display first. System.out.println("This should display first - indicating asynchronous code."); // blocking for final message String elapsedMessage = finalMessage.futureAndAwait(); System.out.println(elapsedMessage); return 0; } public static class Application { public static Promise<List<Integer>> getRange(int n) { final Promise<List<Integer>> promise = Promise.promise(); // non-blocking - this is only for demonstration(emulating some remote call) new Thread(() -> { try { /* * RangeGeneratedPrimes.primes is blocking, only returns when done */ promise.complete(RangeGeneratedPrimes.primes(n)); } catch (Exception exception) { Thread.currentThread().interrupt(); } }).start(); return promise; } public static Promise<List<Integer>> getReverse(int n) { final Promise<List<Integer>> promise = Promise.promise(); new Thread(() -> { try { // Generating a new object stream promise.complete(ReverseGeneratedPrimes.primes(n)); } catch (Exception exception) { Thread.currentThread().interrupt(); } }).start(); return promise; } public static Promise<Tuple2<Promise<List<Integer>>, Promise<List<Integer>>>> getCombined(int ran, int rev) { final Promise<Tuple2<Promise<List<Integer>>, Promise<List<Integer>>>> promise = Promise.promise(); new Thread(() -> { try { Uni.combine().all() /* * Notice that these are running concurrently */ .unis(Uni.createFrom().item(Application.getRange(ran)), Uni.createFrom().item(Application.getReverse(rev))) .asTuple().onItem().call(tuple -> { promise.complete(tuple); return Uni.createFrom().nullItem(); }) .onFailure().invoke(Throwable::printStackTrace) .subscribeAsCompletionStage(); } catch (Exception exception) { Thread.currentThread().interrupt(); } }).start(); return promise; } public static void runTraditionalMethod() { Long millis = System.currentTimeMillis(); System.out.println("Traditiona1-1: " + RangeGeneratedPrimes.primes(115000).size()); System.out.println("Traditiona1-2: " + RangeGeneratedPrimes.primes(10000).size()); System.out.println("Traditiona1-3: " + ReverseGeneratedPrimes.primes(15000).size()); System.out.println("Traditiona1-4: " + ReverseGeneratedPrimes.primes(24000).size()); System.out.println(String.format("Elapsed time for traditional method: %d milliseconds\n", System.currentTimeMillis() - millis)); } } public interface Primes { static List<Integer> primes(int n) { return null; }; } public abstract static class PrimeBase { static boolean isPrime(int number) { return IntStream.rangeClosed(2, (int) (Math.sqrt(number))) .allMatch(n -> number % n != 0); } } public static class RangeGeneratedPrimes extends PrimeBase implements Primes { public static List<Integer> primes(int n) { return IntStream.rangeClosed(2, n) .filter(x -> isPrime(x)).boxed() .collect(Collectors.toList()); } } public static class ReverseGeneratedPrimes extends PrimeBase implements Primes { public static List<Integer> primes(int n) { List<Integer> list = IntStream.generate(getReverseList(n)).limit(n - 1) .filter(x -> isPrime(x)).boxed() .collect(Collectors.toList()); return list; } private static IntSupplier getReverseList(int startValue) { IntSupplier reverse = new IntSupplier() { private int start = startValue; public int getAsInt() { return this.start--; } }; return reverse; } }
}
Testing
The Quarkus install showcases the quarkus-resteasy extension by default. We are not using it, replace the contents of src/test/java/org/demo/mag/StartupTest.java with:
The next step is to build the project. This includes downloading all dependencies as well as compiling and executing the Startup.java program. Everything is included in one file for brevity.
$ ./gradlew quarkusDev
The above command produces a banner and console output from Quarkus and the program.
This is development mode. Notice the prompt: “Press [space] to restart”. To review edits hit the space-bar and enter-key to re-compile and execute. Enter q to quit.
To build an Uber jar (all dependencies included) execute:
Traditional-1: 9592 Traditional-2: 1229 Traditional-3: 2262 Traditional-4: 2762 Elapsed time for traditional method: 67 milliseconds Combined Range: 1229 This should display first - indicating asynchronous code. Combined Reverse: 2262 Primes Reverse: 2762 Asserting that expected primes are equal: 2 -- 2 Primes Range: 9592 Elapsed time for asynchronous method: 52 milliseconds
You will still get the banner and logs in development mode.
To go one step further, Quarkus can generate an executable out of the box using GraalVM.
$ ./gradlew build -Dquarkus.package.type=native
The executable generated by the above command will be ./build/mutiny-demo-1.0.0-runner.
The default GraalVM is a downloaded container. To override this, set the environment variable GRAALVM_HOME to your local install. Don’t forget to install the native-image with the following command.
$ ${GRAALVM_HOME}/bin/gu install native-image
The Code
The code, generates prime numbers for a range, reversed on a limit and a combination of the two. For example, consider the range: “Promise<List<Integer>> promiseRange = Application.getRange(115000);”.
This generates all primes between 1 and 115000 and displays the number of primes in the range. It is executed first but displays its results last. The code near the end of the main method — System.out.println (“This should display first – indicating asynchronous code.”);— displays first. This is an example of asynchronous code. We can run multiple processes concurrently. However, the order of completion is unpredictable. The traditional calls are orderly and the results can be collected when completed.
Execution can be blocked until a result is returned. The code does exactly that to display the asynchronous elapsed time message. At the end of the main method we have: “String elapsedMessage = finalMessage.futureAndAwait();”. The message arrives from either promiseRange or promiseCombined — the two longest running processes. But even this is not guaranteed. The state of the underling OS is unknown. One of the other processes might finish last. Normally, asynchronous calls are nested to co-ordinate results. This is demonstrated in the promiseCombined promise to evaluate the results of range and reversed primes.
Conclusion
The comparison between the traditional method and asynchronous method suggests that the asynchronous method can be up to 25% faster on a modern computer. An older CPU that does not have the resources and computing power produces results faster with the traditional method. If a computer has many cores, why not use them‽
More documentation can be found on the following web sites.
This article shows the reader how easy it is to get started using pods with Podman on Fedora. But what is Podman? Well, we will start by saying that Podman is a container engine developed by Red Hat, and yes, if you thought about Docker when reading container engine, you are on the right track. A whole new revolution of containerization started with Docker, and Kubernetes added the concept of pods in the area of container orchestration when dealing with containers that share some common resources. But hold on! Do you really think it is worth sticking with Docker alone by assuming it’s the only effective way of containerization? Podman can also manage pods on Fedora as well as the containers used in those pods.
Podman is a daemonless, open source, Linux native tool designed to make it easy to find, run, build, share and deploy applications using Open Containers Initiative (OCI) Containers and Container Images.
From the official Podman documentation at http://docs.podman.io/en/latest/
Why should we switch to Podman?
Podman is a daemonless container engine for developing, managing, and running OCI Containers on your Linux System. Containers can either be run as root or in rootless mode. Podman directly interacts with an image registry, containers and image storage.
Install Podman:
sudo dnf -y install podman
Creating a Pod:
To start using the pod we first need to create it and for that we have a basic command structure
$ podman pod create
The command above contains no arguments and hence it will create a pod with a randomly generated name. You might however, want to give your pod a relevant name. For that you just need to modify the above command a bit.
$ podman pod create --name climoiselle
The pod will be created and will report back to you the ID of the pod. In the example shown the pod was given the name ‘climoiselle’. To view the newly created pod is easy by using the command shown below:
$ podman pod list
Newly created pods have been deployed
As you can see, there are two pods listed here, one named darshna and the one created from the example named climoiselle. No doubt you notice that both pods already include one container, yet we sisn’t deploy a container to the pods yet.
What is that extra container inside the pod? This randomly generated container is an infra container. Every podman pod includes this infra container and in practice these containers do nothing but go to sleep. Their purpose is to hold the namespaces associated with the pod and to allow Podman to connect other containers to the pod. The other purpose of the infra container is to allow the pod to keep running when all associated containers have been stopped.
You can also view the individual containers within a pod with the command:
$ podman ps -a --pod
Add a container
The cool thing is, you can add more containers to your newly deployed pod. Always remember the name of your pod. It’s important as you’ll need that name in order to deploy the container in that pod. We’ll use the official ubuntu image and deploy a container using it running the top command.
$ podman run -dt --pod climoiselle ubuntu top
Everything in a Single Command:
Podman has an agile characteristic when it comes to deploying a container in a pod which you created. You can create a pod and deploy a container to the said pod with a single command using Podman. Let’s say you want to deploy an NGINX container, exposing external port 8080 to internal port 80 to a new pod named test_server.
$ podman run -dt --pod new:test_server -p 8080:80 nginx
Created a new pod and deployed a container together
Let’s check all pods that have been created and the number of containers running in each of them …
$ podman pod list
List of the containers, their state and number of containers running into them
Do you want to know a detailed configuration of the pods which are running? Just type in the command shown below:
podman pod inspect [pod's name/id]
Make it stop!
To stop the pods, we need to use the name or ID of the pod. With the information from podman’s pod list command, we can view the pods and their infra id. Simply use podman with the command stop and give the particular name/infra id of the pod.
$ podman pod stop climoiselle
Hey take a look!
My pod climoiselle stopped
After following this short tutorial, you can see how quickly you can use pods with podman on fedora. It’s an easy and convenient way to use containers that share resources and interact together.