Let’s go through the functions using “code snippets”:
Find a location by name (from_geocode)
With the geocode method of the GoogleMapPlotter object, we can display a given address and its neighbourhood on the map.
Parameters of the method: location (str), zoom (int), apikey (str)
After creating your map, you have two options, either save the HTML file (.draw()) or store it as a string (with .get()). I use the .draw() method, where the only parameter is the file to create and its path.
The code imports the gmplot library, which is a Python wrapper for the Google Maps API. It then creates a new GoogleMapPlotter object named gmap for the location “Budapest” using the from_geocode() method. This method uses the Google Maps API to retrieve the latitude and longitude of the location, which is necessary to display the map.
Finally, the draw() method is called on the gmap object to generate and save the map as an HTML file named budapest_map.html.
Coordinates of a location (geocode)
If you want to know the coordinates of a location, use .geocode(). As an input parameter, pass the name (str) of the place you are looking for and your API key. This returns a tuple of the lat/long coordinates of the given location (float, float).
The code calls the geocode() method on the GoogleMapPlotter object to obtain the latitude and longitude of a location specified as a string. In this case, the location is “Budapest, Hungary”. The apikey parameter is also passed to this method to authenticate the Google Maps API.
Text on your map (text)
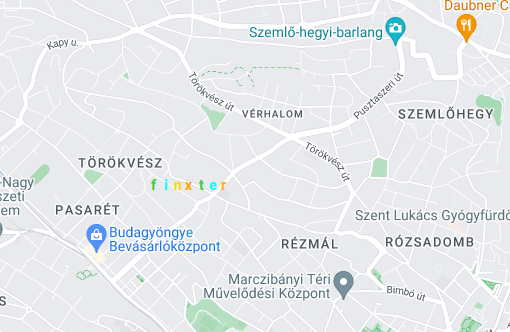
If you want to place custom text on your map, you can do it with .text(), using the text label’s Latitude and Longitude parameter.
It is possible to color the text with the color=str parameter, which can be the color name ('black'), hexadecimal ('#000000'), or matplotlib-like ('k').
import gmplot

apikey = ' ' # (your API key here)

gmap = gmplot.GoogleMapPlotter(47.519350864380385, 19.010462124312387, zoom = 17, apikey=apikey)

finxter_text = ['f', 'i', 'n', 'x', 't', 'e', 'r']

colors = ['limegreen', 'cyan', 'gold','orange', 'limegreen', 'cyan', 'orange']

j = 0

lat = 47.529266431577625

lng = 19.00500303401821

for i in finxter_text: gmap.text(lat, lng, i, color = colors[j]) j += 1 lng += 0.001
Result:
Drop marker (marker)
Show markers. The required parameters are, of course, the Latitude and Longitude coordinates (float, float), and additional optional parameters can be used to customize the markers:
color (str) which can be the name of the color ('black'), hexadecimal ('#000000'), or matplotlib-like ('k')
title (str) : Hover-over title of the marker.
precision (int) : Number of digits after the decimal to round to for lat/long values. Defaults to 6.
label (str) : Label displayed on the marker.
info_window (str) : HTML content to be displayed in a pop-up info window.
draggable (bool) : Whether or not the marker is draggable.
gmap.enable_marker_dropping() allows markers to be dropped onto the map when clicked. Clicking on a dropped marker will delete it.
Note: Calling this function multiple times will just overwrite the existing dropped marker settings.
Parameters:
color str: Color of the markers to be dropped.
title str: Hover-over title of the markers to be dropped.
label str: Label displayed on the markers to be dropped.
draggable bool: Whether or not the markers to be dropped are draggable.
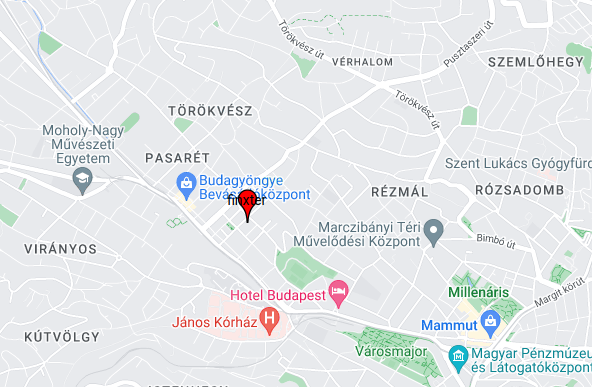
Result:
The code adds a marker to the Google Maps plot. The marker is placed at the latitude and longitude coordinates (47.51503432784726, 19.005350430919034) and is labeled 'finxter'.
The info_window parameter sets the information displayed when the user clicks on the marker. In this case, it is a link to the Finxter Academy website.
The draggable parameter is set to False, meaning that the user cannot move the marker.
The fourth line enables marker dropping, meaning the user can add new markers to the plot by clicking on the map.
The final line saves the plot to an HTML file named marker.html.
Route planning (directions)
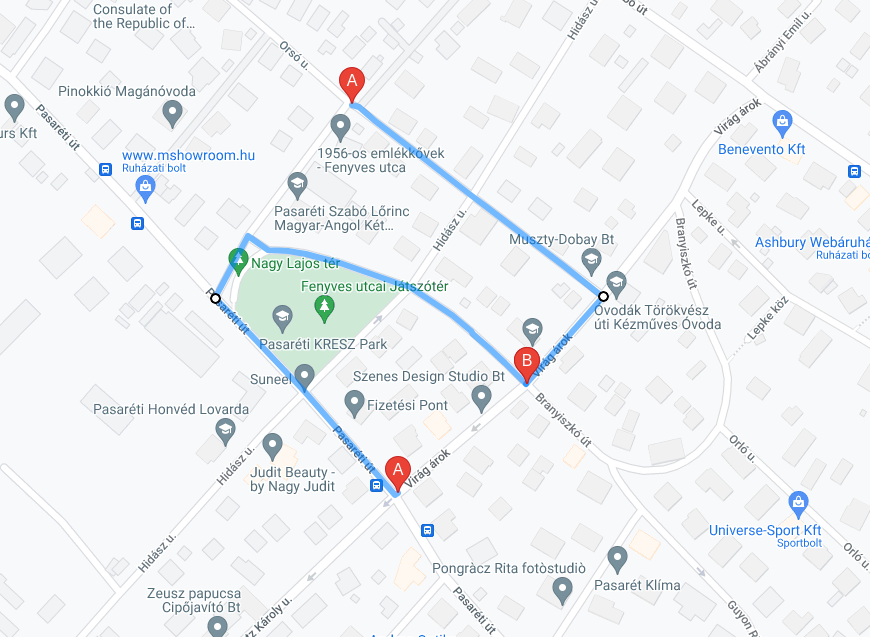
Using the Directions API, you can display route planning between any points. The origin and destination coordinates are given as parameters (float, float). Optionally, the waypoints as list of tuples and the travel_mode as str can also be specified. The travel modes are:
DRIVING (Default) indicates standard driving directions using the road network.
BICYCLING requests bicycling directions via bicycle paths & preferred streets.
TRANSIT requests directions via public transit routes.
WALKING requests walking directions via pedestrian paths & sidewalks.
The fourth line adds a route to the plot using the directions() method.
The starting point of the route is at latitude 47.5194613766804 and longitude 19.000656008676216, and the ending point is at latitude 47.520243896650946 and longitude 19.00204002854648.
The waypoints parameter is set to a list containing one set of latitude and longitude coordinates (47.520888742275, 18.99871408933636).
The fifth line adds another route to the plot, starting at the same point as the previous route and ending at the same point as the previous route, but with different waypoints.
The sixth line adds a third route to the plot, with a starting point at latitude 47.52226897515179 and longitude 19.00018393988221, an ending point at latitude 47.520243896650946 and longitude 19.00204002854648, and a set of waypoints containing one set of latitude and longitude coordinates (47.52088149688948, 19.002871513347902).
Display many points (scatter)
The scatter() allows you to place many points at once. In addition to the necessary lat (float) and lon (float) parameters, the following optional parameters are:
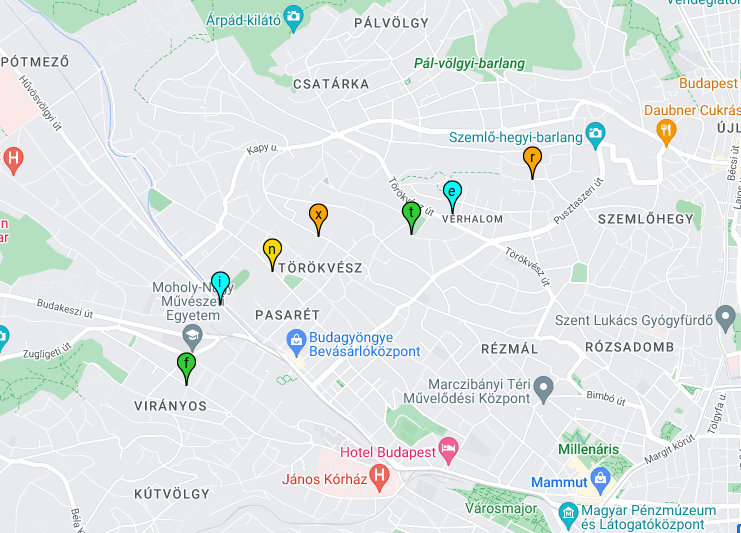
The fourth line defines a list of latitude and longitude coordinates as tuples, representing the locations of individual letters of the word 'finxter'.
The fifth line uses the scatter() method of adding the letters to the plot as points. The scatter() method takes the latitude and longitude coordinates as separate arguments using the unpacking operator (*letters).
The color parameter is set to a list of colors that correspond to the letters. The s parameter specifies the size of the points, the ew parameter specifies the width of the edge around the points, and the title and label parameters specify the title and label of each point, respectively.
Draw circle (circle)
Sometimes it is useful to draw a circle. In addition to specifying the center lat, lng, and radius of the circle, you can also to specify the following:
edge_alpha/ea float: Opacity of the circle’s edge, ranging from 0 to 1. Defaults to 1.0.
edge_width/ew int: Width of the circle’s edge, in pixels. Defaults to 1.
face_alpha/alpha float: Opacity of the circle’s face, ranging from 0 to 1. Defaults to 0.5.
color/c/face_color/fc str: Color of the circle’s face. Can be hex (“#00FFFF”), named (“cyan”), or matplotlib-like (“c”). Defaults to black.
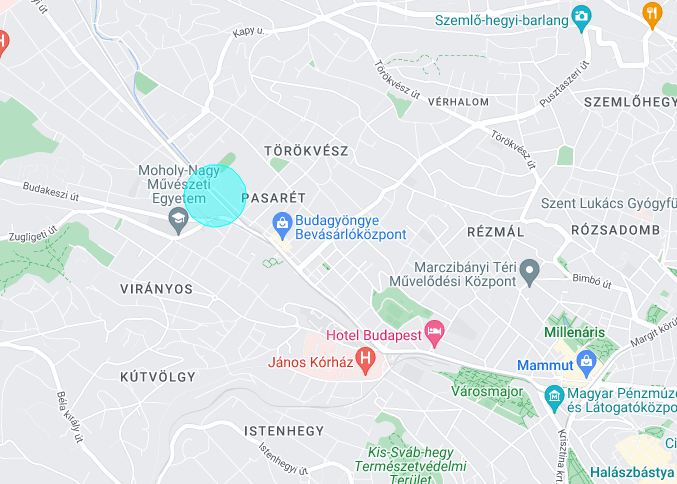
The fourth line uses the circle() method to add a circle to the plot.
The circle() method takes the latitude and longitude coordinates of the center of the circle as its first two arguments, followed by the radius of the circle in meters.
The face_alpha parameter specifies the transparency of the circle fill, while the ec and fc parameters specify the color of the circle edge and fill, respectively.
Polyline (plot)
A polyline is a line composed of one or more sections. If we want to display such a line on our map, we use the plot method. In addition to the usual lats [float], lons [float] parameters, you can specify the following optional parameters:
color/c/edge_color/ec str : Color of the polyline. Can be hex (“#00FFFF”), named (‘cyan’), or matplotlib-like (‘c’). Defaults to black.
alpha/edge_alpha/ea float: Opacity of the polyline, ranging from 0 to 1. Defaults to 1.0.
edge_width/ew int: Width of the polyline, in pixels. Defaults to 1.
precision int: Number of digits after the decimal to round to for lat/lng values. Defaults to 6.
This line creates a list of latitude-longitude pairs that define the vertices of a polygon. The zip(*[...]) function is used to transpose the list so that each pair of latitude-longitude values becomes a separate tuple.
gmap.plot(*f, edge_width = 7, color = 'limegreen')
This line plots the polygon on the Google Map. The plot() function takes the *f argument, which is unpacked as separate arguments, representing the latitude and longitude values of the polygon vertices. The edge_width parameter sets the width of the polygon edges in pixels and the color parameter sets the color of the edges.
radius [int]: Radius of influence for each data point, in pixels. Defaults to 10.
gradient [(int, int, int, float)]: Color gradient of the heatmap as a list of RGBA colors. The color order defines the gradient moving towards the center of a point.
opacity [float]: Opacity of the heatmap, ranging from 0 to 1. Defaults to 0.6.
max_intensity [int]: Maximum intensity of the heatmap. Defaults to 1.
dissipating [bool]: True to dissipate the heatmap on zooming, False to disable dissipation.
precision [int]: Number of digits after the decimal to round to for lat/lng values. Defaults to 6.
weights [float]: List of weights corresponding to each data point. Each point has a weight of 1 by default. Specifying a weight of N is equivalent to plotting the same point N times.
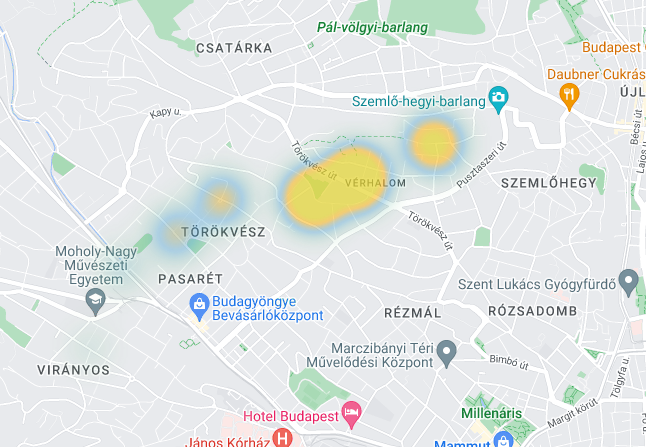
First, a list of tuples called letters is created. Each tuple contains two values representing latitude and longitude coordinates of a point on the map.
Then, an instance of the GoogleMapPlotter class is created with a specified center point, zoom level, and an API key.
Next, the heatmap method of the GoogleMapPlotter object is called, passing in the letters list as positional arguments, along with other parameters.
The radius parameter determines the radius of each data point’s influence on the heatmap, while the weights parameter determines the intensity of each data point’s contribution to the heatmap.
The gradient parameter is a list of tuples representing the color gradient of the heatmap, with each tuple containing four values representing red, green, blue, and alpha values.
Finally, the opacity parameter determines the transparency of the heatmap.
Picture above the map (ground_overlay)
Overlay an image from a given URL onto the map.
Parameters:
url [str]: URL of image to overlay.
bounds [dict]: Image bounds, as a dict of the form {'north':, 'south':, 'east':, 'west':}.
Optional Parameters:
opacity [float]: Opacity of the overlay, ranging from 0 to 1. Defaults to 1.0.
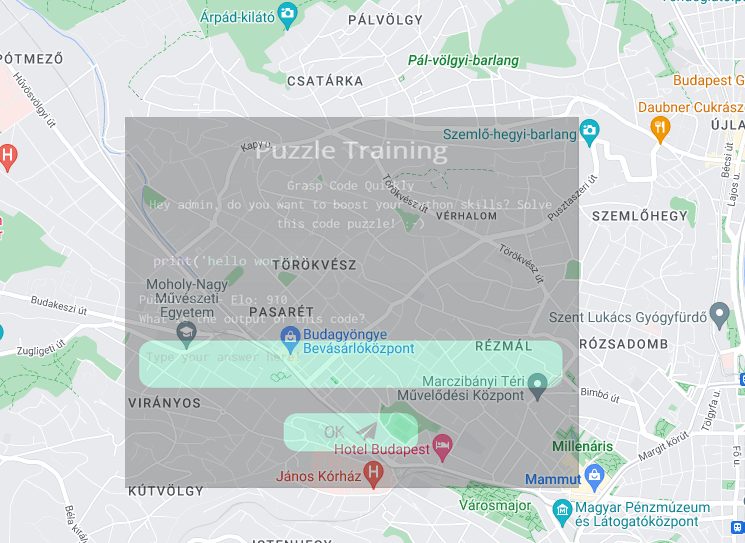
The variable url contains the URL of an image that will be used as the ground overlay. The bounds dictionary defines the north, south, east, and west coordinates of the image on the map.
Finally, the ground_overlay method is called on the GoogleMapPlotter object, passing the URL and bounds variables as arguments. The opacity parameter is set to 0.3 to make the overlay partially transparent. The resulting map is saved to a file called overlay.html using the draw method.
Plot a Polygon
Parameters:
lats [float]: Latitudes.
lngs [float]: Longitudes.
Optional Parameters:
color/c/edge_color/ec str: Color of the polygon’s edge. Can be hex (“#00FFFF”), named (“cyan”), or matplotlib-like (“c”). Defaults to black.
alpha/edge_alpha/ea float: Opacity of the polygon’s edge, ranging from 0 to 1. Defaults to 1.0.
edge_width/ew int: Width of the polygon’s edge, in pixels. Defaults to 1.
alpha/face_alpha/fa float: Opacity of the polygon’s face, ranging from 0 to 1. Defaults to 0.3.
color/c/face_color/fc str: Color of the polygon’s face. Can be hex (“#00FFFF”), named (“cyan”), or matplotlib-like (“c”). Defaults to black.
precision int: Number of digits after the decimal to round to for lat/lng values. Defaults to 6.
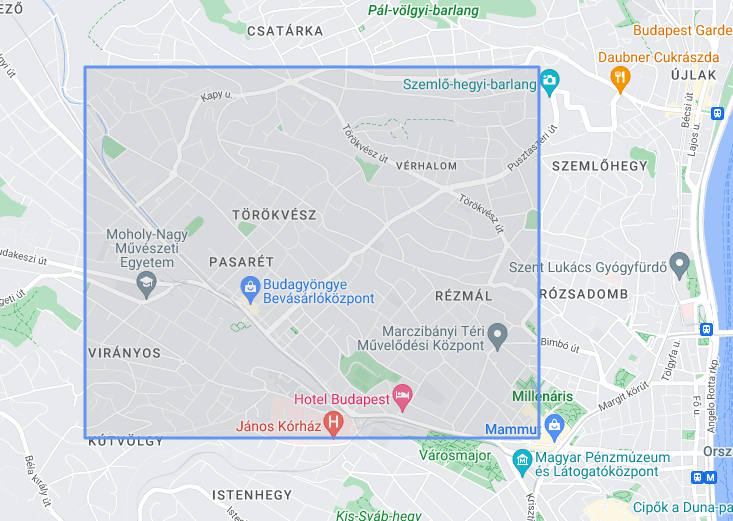
Defines a set of coordinates for a polygon named finxter_in_Budapest.
Calls the gmap.polygon() method with the *finxter_in_Budapest argument to draw the polygon on the map. The face_color, face_alpha, edge_color, and edge_width parameters define the appearance of the polygon.
Saves the map as an HTML file named 'poligon.html' using the gmap.draw() method.
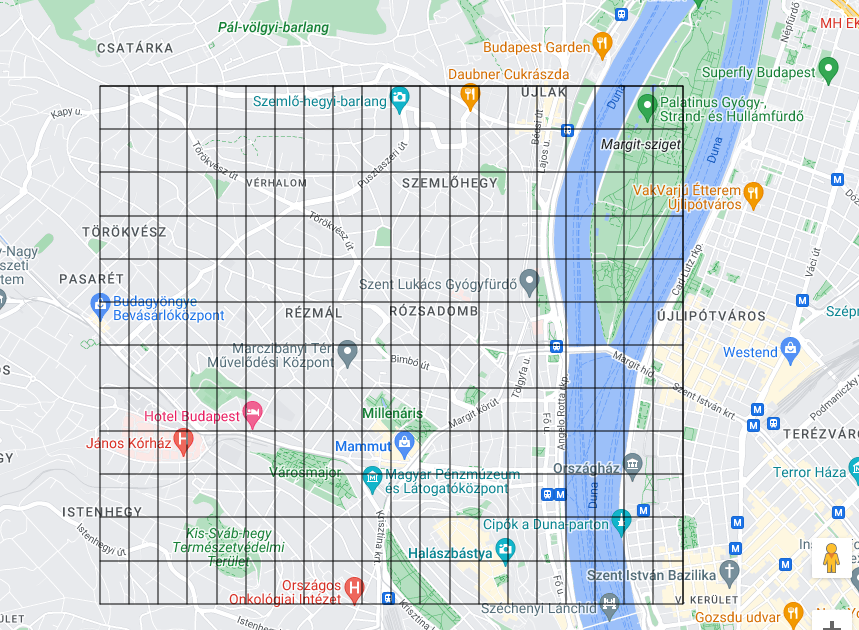
Display grid (grid)
The parameters are used to specify the grid start and end points and the width and length of the grid.
This code generates a Google Map centered at latitude 47.519350864380385 and longitude 19.010462124312387, with a zoom level of 14. It then adds a grid to the map with vertical lines spaced 0.0025 degrees apart between longitude 19.0 and 19.05, and horizontal lines spaced 0.0025 degrees apart between latitude 47.50 and 47.53. Finally, it saves the resulting map with the grid to an HTML file named "grid.html".
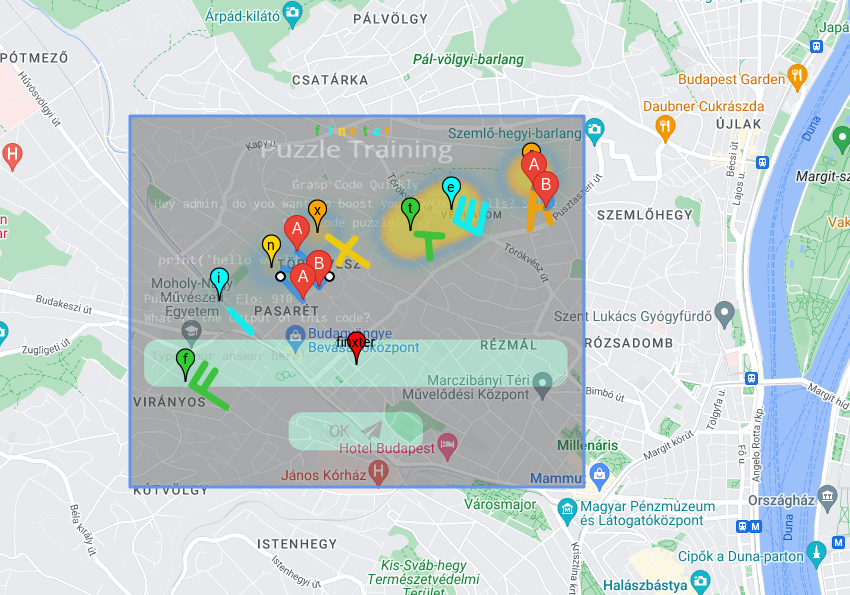
Let’s put it together and see where I found “finxter”!
Congratulations, now you’ve learned how to draw almost anything on Google Maps with a few lines of code. While gmplot is a powerful library, it has some limitations (e.g., I can’t figure out how to change the color of the path), so maybe other modules like geopandas are a good place to learn more.
A Few Final Words on gmplot
gmplot is a Python library that allows the user to plot data on Google Maps. It provides a simple interface to create various types of maps, including scatterplots, heatmaps, ground overlays, and polygons.
With gmplot, the user can add markers, lines, and shapes to the map, customize colors, labels, and other properties, and export the map to a static HTML file.
The library uses the Google Maps API and requires an API key to be able to use it. gmplot is a useful tool for visualizing geospatial data and creating interactive maps for data exploration and analysis.
How to grab Deep Sky Derelicts - Go to the home page of https://www.gog.com/#giveaway - Login and Register - Go to the home page again - Wait for 10 seconds then start searching for Deep Sky Derelicts - on the home page look for "Deal of the Day" (there should be a banner below or above it) - on the banner there is a button "Yes, and claim the game" click it - That's it
In a ravaged civilization, where infected and hardened survivors run rampant, Joel, a weary protagonist, is hired to smuggle 14-year-old Ellie out of a military quarantine zone. However, what starts as a small job soon transforms into a brutal cross-country journey. Includes the complete The Last of Us single-player story and celebrated prequel chapter, Left Behind, which explores the events that changed the lives of Ellie and her best friend Riley forever.
Posted by: xSicKxBot - 04-01-2023, 10:07 AM - Forum: Python
- No Replies
10 Best ChatGPT Books for AI Enthusiasts in 2023
5/5 – (1 vote)
Info: I haven’t used any affiliate links in this list, so you know there’s no bias. If you want to boost your ChatGPT skills, feel free to download our ChatGPT cheat sheet for free here.
If you want more cheat sheets and be on the right side of change, feel free to join our free email academy on learning exponential technologies such as crypto, Blockchain engineering, ChatGPT, Python, and meaningful coding projects.
ChatGPT technology has seen use in various industries, such as customer support, content creation, virtual assistance, and many others. For those looking to stay abreast of cutting-edge AI technology or seeking to implement ChatGPT into their products or services, learning from the best books is paramount to their success.
In our search for the best ChatGPT books, we analyzed numerous texts, focusing on their coverage of concepts, functionality, and real-world applications. We identified top contenders that help you master this technology quickly and thoroughly, ensuring your success in leveraging ChatGPT for your personal endeavors or professional projects.
Best ChatGPT Books
Discover our top picks for the best ChatGPT books available on Amazon.
If you’re aiming to stay ahead in the AI-driven digital media landscape, “The ChatGPT Revolution” is a must-read.
Pros
Insightful AI industry knowledge
Practical tips for career transition
Well-organized information
Cons
Relatively short in length
Only in English
Independently published
As someone who’s always on the lookout for the next big thing in AI, I couldn’t wait to get my hands on “The ChatGPT Revolution.” I must say, this book didn’t disappoint. The detailed information about how AI is transforming the digital media landscape makes it engaging and easy to follow, even for a non-expert like me.
One of the critical aspects that stood out to me is the book’s focus on career transition for digital media professionals. It not only highlights the in-demand AI skills but also provides a list of learning resources to guide you in the right direction. This book is a treasure trove for anyone looking to break into the AI job market!
Although the book’s length seems a bit short, the content is undoubtedly rich in valuable insights and practical tips. My only regret is not having access to a translated version for my non-English-speaking friends. But overall, “The ChatGPT Revolution” is an indispensable resource for anyone interested in AI or digital media. Trust me, you won’t want to miss this one.
If you’re eager to conquer the world of social media marketing, this book will equip you with the power of ChatGPT and practical strategies.
Pros
Demystifies the use of AI in social media marketing
Offers valuable insights for beginners and experts alike
Provides real-world examples and case studies
Cons
Not suitable for those uninterested in AI integration
Requires time investment to fully grasp concepts
Not a shortcut to instant success
As someone who has read “ChatGPT & Social Media Marketing: The Ultimate Guide,” I can confidently say that it provides a deep understanding of how artificial intelligence, particularly ChatGPT, can revolutionize one’s social media marketing approach. The book is packed with helpful tips and tools to create engaging and effective campaigns, regardless of the platform you’re using.
Going through this guide felt like a journey of discovering new ways to enhance my social media presence. It highlights the importance of crafting captivating content, and how ChatGPT can significantly aid in that process. The book also addresses common challenges faced by marketers and offers practical solutions to overcome them.
In conclusion, if you’re looking to up your social media marketing game using AI, this book is a must-read. It may not be a magical key to instant success, but it will certainly provide you with the knowledge and tools needed to stay ahead of the competition. Give it a try, and let ChatGPT help you become the world’s best social media manager!
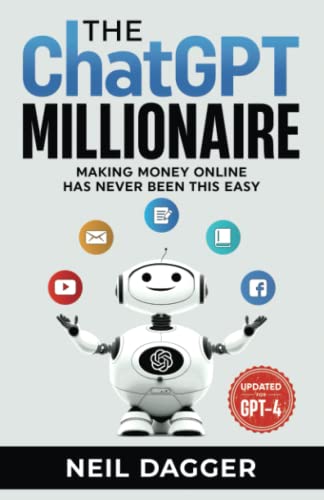
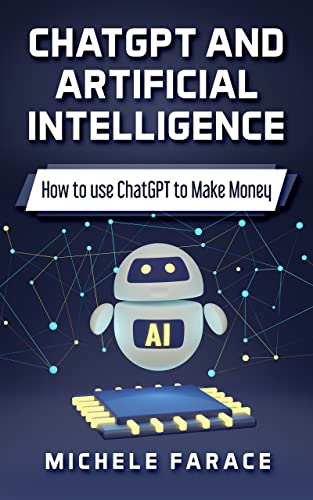
The ChatGPT Millionaire is a must-read for those who want to learn how to utilize ChatGPT to create financial success online.
Pros
Helpful for beginners and professionals alike
Practical and applicable tips
Engaging and easy-to-understand writing
Cons
A bit short and compact
Some filler ChatGPT responses
May not suit everyone’s needs
The ChatGPT Millionaire is a fantastic guide that introduces readers to the world of ChatGPT, making it accessible for both newbies and seasoned professionals. With its real-life examples and applicable tips, this book brings value to anyone eager to leverage the power of ChatGPT for financial gains.
Although the book is concise with its 114 pages, it manages to offer valuable information in an easy-to-digest manner. However, some readers might find it too short to cover every aspect of ChatGPT. A few filler ChatGPT responses in the book might also come across as unnecessary, though they do provide context for the technology.
Overall, The ChatGPT Millionaire is a valuable resource on its subject matter, and despite some minor shortcomings, it’s worth adding to your reading list if you are keen to explore the potential of ChatGPT in creating wealth and success online.
An enlightening read for those eager to dive deep into the ChatGPT world, uncovering the artificial intelligence behind it and how it works.
Pros
Insightful explanations
Easy-to-understand language
Practical examples
Cons
Limited audience appeal
May need prior AI knowledge
Few visual aids
Having just finished reading “The AI Question and Answer Book,” I am amazed by how this book unravels the complexity of ChatGPT in a digestible manner. The author breaks down the intricate workings of artificial intelligence and how it pertains to ChatGPT throughout the book’s 205 pages.
What I truly appreciate in this volume is the clear language used to explain technical concepts, making it an excellent resource for both beginners and advanced AI enthusiasts alike. It covers various aspects of ChatGPT, offering a comprehensive understanding of the technology that powers it.
However, the book does have a few drawbacks. It caters mostly to individuals with an interest in AI, making its appeal somewhat limited. Additionally, readers may need to have a basic understanding of AI to fully appreciate the content. The lack of visual aids may also hinder comprehension for some readers. Nonetheless, this fascinating read will undoubtedly offer valuable insights into the world of ChatGPT and artificial intelligence.
If you’re an educator looking to effectively utilize ChatGPT, this guide is a fantastic resource to help you achieve maximum results.
Pros
Comprehensive coverage of ChatGPT applications
Aligns well with ‘What Works Best’ framework
Accessible language for educators
Cons
No text-to-speech option
Lacks enhanced typesetting
Page Flip feature not available
Just finished going through “A Teacher’s Prompt Guide to ChatGPT” and found it to be an excellent resource for educators who are eager to incorporate ChatGPT into their teaching repertoire. The author masterfully covers the core applications of ChatGPT and aligns them with the ‘What Works Best’ framework, ensuring that the content is relevant and beneficial for educators.
In my experience with the book, the language used is easily digestible for teachers from various backgrounds. The guide maintains a practical tone throughout, avoiding complicated jargon that might hinder a seamless learning experience. However, there’s room for improvement in terms of accessibility features.
Unfortunately, the guide doesn’t include text-to-speech, enhanced typesetting, or Page Flip features, which could be a deal-breaker for some users who rely on these options for a more accessible reading experience. Despite these drawbacks, I still believe that “A Teacher’s Prompt Guide to ChatGPT” is a valuable tool for educators to better understand and apply ChatGPT in their classrooms.
If you’re looking to explore the fascinating world of advanced AI language generation, this book serves as a fantastic guide.
Pros
In-depth user perspective
Up-to-date AI language model
Easy to follow & informative
Cons
Only 70 pages
Independently published
Limited physical dimensions
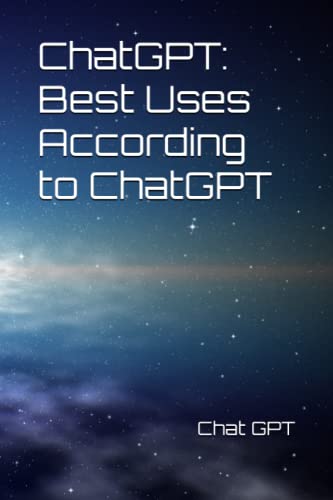
ChatGPT: Best Uses According to ChatGPT dives deep into the potential applications of AI-powered language models. The author has done a phenomenal job explaining the different capabilities of this advanced language model, discussing its uses, and shedding light on how it can transform industries.
While the book is fairly short, it packs a punch in terms of content. Readers get a unique perspective on what makes ChatGPT such a game-changer, thanks to the author’s engaging writing. The book offers a truly eye-opening look at how ChatGPT’s language generation capabilities can be utilized effectively for various purposes.
Overall, ChatGPT: Best Uses According to ChatGPT is a compelling read for anyone looking to understand and enhance their AI language model experience. It provides practical and enlightening tips on how to maximize the benefits of using ChatGPT, without resorting to exaggerated claims or false statements.
A comprehensive must-read for those interested in leveraging ChatGPT and AI technologies to enhance their skills and career prospects.
Pros
Informative and beginner-friendly
Up-to-date and relevant content
Text-to-speech and screen reader support
Cons
No X-Ray feature
Some reviews report formatting issues
Can be difficult for some readers
As someone who recently dived into the world of ChatGPT and AI, I found this book to be an invaluable resource. It does an exceptional job of breaking down complex concepts into digestible information for readers with little to no experience.
One aspect of the book that stood out to me was the depth of content and its relevance to today’s ever-evolving AI landscape. The author goes above and beyond to ensure that the reader is not only able to understand the basics of ChatGPT but also appreciates the greater role of AI technologies in our lives and professions.
While the book’s formatting could use some improvement, I found the support for text-to-speech and screen readers to be a huge plus! It made the learning experience much more accessible, especially for readers with visual impairments or learning differences. However, the lack of an X-Ray feature is a minor drawback for those who depend on it for quick reference.
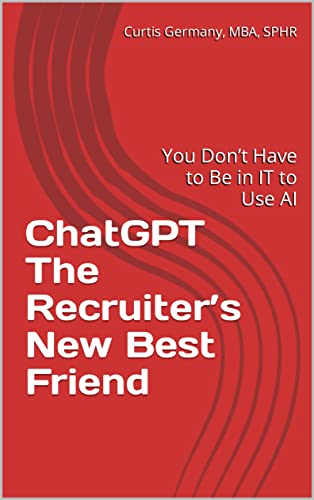
A must-read for recruiters looking to enhance their process with AI, Curtis Germany’s e-book delivers practical insights and tips.
Pros
Brief, informative read
Relevant examples of AI in recruitment
Accessible for non-IT professionals
Cons
Short length may leave readers wanting more
Narrow focus on recruitment industry
Lacks exploration of broader AI applications
As someone who has just read “ChatGPT The Recruiter’s New Best Friend,” I can confidently say this e-book is a great resource for recruiters looking to integrate AI into their workflow. The author explains in layman’s terms how ChatGPT can streamline various recruitment tasks, from sourcing to job offers.
Curtis Germany’s engaging writing style makes understanding the concepts a breeze, even for those unfamiliar with AI. He shares valuable insights that can be immediately applied to enhance daily tasks, boosting productivity in recruitment efforts. Moreover, the book’s short length makes it easy to digest, maximizing the time spent reading and applying its principles.
Despite its practical focus, it has a few drawbacks. The book’s brevity may leave some readers wanting more detailed and expansive information on broader AI applications. However, if you are a recruiter or an HR professional eager to dip your toes into the AI pool, this e-book offers the perfect starting point!
This book is a must-have for anyone looking to supercharge their AI communication skills and improve productivity with OpenAI’s ChatGPT platform.
Pros
Offers over 200 useful prompts
Elevates productivity by 10x
Applicable for ChatGPT and GPT-3
Cons
Only 62 pages of content
No X-Ray support
English language only
As someone who recently delved into “OpenAI’s ChatGPT prompts book to increase productivity by 10x,” I found it to be an invaluable resource for mastering the art of AI communication. The book features an extensive collection of prompts, specifically designed to work seamlessly with ChatGPT and GPT-3 platforms.
With over 200 stimulating prompts, you’re bound to find plenty of inspiration for crafting engaging conversations with AI. The most significant selling point of the book is its potential to increase your productivity by ten-fold. While reading, I noticed a marked improvement in my ability to generate compelling responses from my AI conversation partners, saving time and effort on tasks that once felt tedious.
However, the 62-page length of the book might leave some readers wanting more. Additionally, it would have been nice to see support for Amazon’s X-Ray feature, which enhances the reading experience through helpful information and insights. Overall, this book is an excellent investment for those seeking to up their AI communication game and unlock the true potential of ChatGPT and GPT-3.
If you’re looking to delve into the world of ChatGPT technology, this comprehensive guide should be your go-to resource.
Pros
Expertly written and easy to understand
Highly relevant in today’s AI-driven world
Adopts a hands-on approach with practical examples
Cons
Only available in paperback format
112 pages may feel a bit condensed for the topic
Independently published, which may affect credibility for some
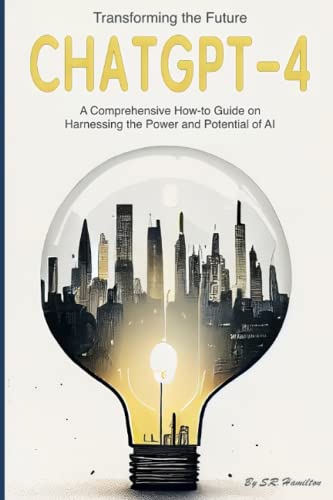
The book “ChatGPT-4: Transforming the Future: A Comprehensive How-to Guide on Harnessing the Power and Potential of AI” is a must-read for anyone curious about this fascinating AI technology. After going through its 112 pages, I found the content to be insightful, well-organized, and highly informative.
One of the things that stood out to me was the book’s clarity in explaining complex concepts. The author has done a commendable job at breaking down ChatGPT-4 technology and its potential applications in a way that even a beginner can grasp with ease. Additionally, this guide is packed with real-world examples and hands-on techniques that will surely improve your understanding of AI capabilities in practical scenarios.
The only downside is that the book is currently available only in paperback format, which might not be ideal for those who prefer digital reading material. Additionally, given its independent publication, skeptics may question its credibility compared to a book released by a more established publisher. Regardless, “ChatGPT-4: Transforming the Future” proves to be a valuable resource, and I highly recommend it to anyone looking to explore AI’s potential through the lens of ChatGPT technology.
[freebies.indiegala.com] [freebies.indiegala.com] The Seeker is an action/stealth game, where you are in the role of the little drone that was accidentally activated by the debris that hit the EPC-221. It all began after the Great Galactic war when people had to leave earth, however instead of living peacefully, they destroyed themselves to ashes by their greed for power.
Pandora's Box Bundle | 10 Steam Games | 94% OFF
[www.indiegala.com] Will you allow curiosity take hold of you? This bundled box contains some hidden gems never seen before, filled to the brim with curious objects and mysteries...all you have to do is open the box from HH.
GrabFreeGames NFTs are here! Crypto art for everyone
Yo yo yo, fellow crypto enthusiasts! Have you heard about the latest and greatest NFT collection to hit the blockchain?
Introducing the GFG NFTs! NFT Preview[i.imgur.com]
First off, we only have 420 unique pieces available. You read that right, 420! That's the perfect number, if you catch my drift. And once they're gone, they're gone forever. So if you want to get your hands on one of these babies, you better act fast! Our collection is so sick, you'll be begging for more. We're talking rare digital art pieces that will make your eyes pop out of your skull. These NFTs are so hot, you'll need to wear oven mitts just to handle them. But that's not all, my dudes. We'll throw in a virtual reality experience where you can actually enter the world of the NFT and become the art. We're talking about the most exclusive collection on the planet, with only a limited number of copies available. So if you want to be part of the elite club of GFG NFT owners, you better act fast and snatch up your piece before they're all gone. And that's not all, folks. Each GFG NFT also comes with a unique digital signature from the artist themselves. That's right, you'll be owning a piece of digital art that's been personally authenticated by the creator. But wait, there's more! We're also offering a special promotion for early adopters. The first 69 people to mint a GFG NFT will receive a free Tesla Cybertruck.
All you have to do is go to mint your own GFG NFT is come to our discord server https://discord.gg/9xqfqn2BYV go into the #bots channel and type in the command
gfg mint
and the NFT will be minted and delivered straight to your wallet. It's that simple!
Rockay City. A thriving metropolis with excitement buzzing from the sandy bay to the towering skyscrapers. But beyond the glamour, there is a fierce turf war raging on... After the demise of the previous crime boss, there's an open vacancy for a new King of Rockay City - but it isn't just you who is fighting for the throne. Choose your crew based on their skills and expertise, and execute daring missions with the hopes of walking away with the cash, the turf and, ultimately, the crown.
Crime Boss: Rockay City is an organized crime game combining first-person shooter action and turf wars, playable solo or with friends. Take on the role of Travis Baker - a man with his sights set on becoming the new King of Rockay City, one crime at a time...
The ChartJS library provides modules for creating candlestick charts. It also supports generating OHLC (Open High Low Close) charts.
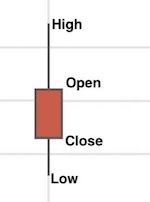
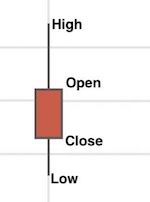
The candlestick and OHLC charts are for showing financial data in a graph. Both these charts look mostly similar but differ in showing the ‘open’ and ‘close’ points.
In this article, we will see JavaScript code for creating a candlestick chart using ChartJs.
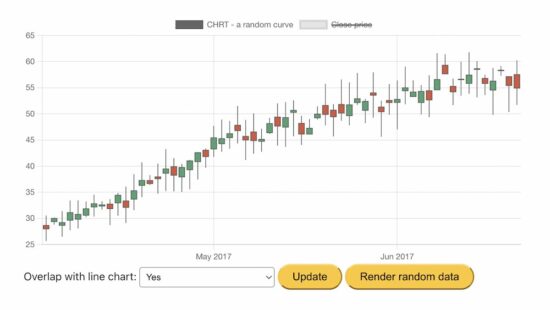
This example generates the random data for the candlestick graph on loading the page.
We have seen many examples of creating ChartJS JavaScript charts. If you are new to the ChartJS library, how to create a bar chart is a simple example for getting started.
How to get and plot candlestick random data via JavaScript?
This JavaScript code uses the chartjs.chart.financial.js script functions to create a candlestick chart.
It generates and uses random bar data for the chart. The random data of each bar includes a horizontal coordinate, x, and four vertical coordinates, o, h, l, and c (open, high, low, close).
It performs the below steps during the chart generation process.
It makes random bar data by taking the initial date and the number of samples.
It initiates the ChartJS class to set the chart type, dataset, and options as we did in other ChartJS examples.
It sets the random bar data to the ChartJS dataset property and updates the chart instance created in step 3.
It checks if the user sets the “Mixed” option and adds the close points to the dataset if yes.
Step 5 overlaps a line chart of close points on the rendered candlestick chart.
chart-data-render.js
var barCount = 60;

var initialDateStr = '01 Apr 2017 00:00 Z'; var ctx = document.getElementById('candlestick-chart').getContext('2d');

ctx.canvas.width = 800;

ctx.canvas.height = 400; var barData = getRandomData(initialDateStr, barCount);

function lineData() { return barData.map(d => { return { x: d.x, y: d.c } }) }; var chart = new Chart(ctx, { type: 'candlestick', data: { datasets: [{ label: 'Random Curve', data: barData }] }

}); function randomNumber(min, max) { return Math.random() * (max - min) + min;

} function randomBar(date, lastClose) { var open = +randomNumber(lastClose * 0.95, lastClose * 1.05).toFixed(2); var close = +randomNumber(open * 0.95, open * 1.05).toFixed(2); var high = +randomNumber(Math.max(open, close), Math.max(open, close) * 1.1).toFixed(2); var low = +randomNumber(Math.min(open, close) * 0.9, Math.min(open, close)).toFixed(2); return { x: date.valueOf(), o: open, h: high, l: low, c: close }; } function getRandomData(dateStr, count) { var date = luxon.DateTime.fromRFC2822(dateStr); var data = [randomBar(date, 30)]; while (data.length < count) { date = date.plus({ days: 1 }); if (date.weekday <= 5) { data.push(randomBar(date, data[data.length - 1].c)); } } return data;

}

var update = function () { var mixed = document.getElementById('mixed').value; var closePrice = { label: 'Close Price', type: 'line', data: null }; // put data in chart if (mixed === 'true') { closePrice = { label: 'Close Price', type: 'line', data: lineData() }; } else { } chart.config.data.datasets = [ { label: 'Random Curve', data: barData }, closePrice ] chart.update();

};

document.getElementById('update').addEventListener('click', update); document.getElementById('randomizeData').addEventListener('click', function () { barData = getRandomData(initialDateStr, barCount); update();

});
More functionalities and features are there in the ChartJS module. It allows customizing the output candlestick chart. This example enables two of them.
Overlap line data over the close points of the candlestick bars.
I am reloading the candlestick with a new set of random bar data.
ChartJS candlestick functionalities
Some possible customization options for the candlestick chart are listed below.
To change the bar type between candlestick and OHLC. The OHLC chart will display the ‘open’ and ‘close’ points by horizontal lines on the candle body.
To change the scale type, border, and color.
To allow overlapping line charts with the rendered candlestick chart to highlight the close points of the bar data.


 but it did help me write the code snippet explanation (which I attached after each code output).
 Recommended: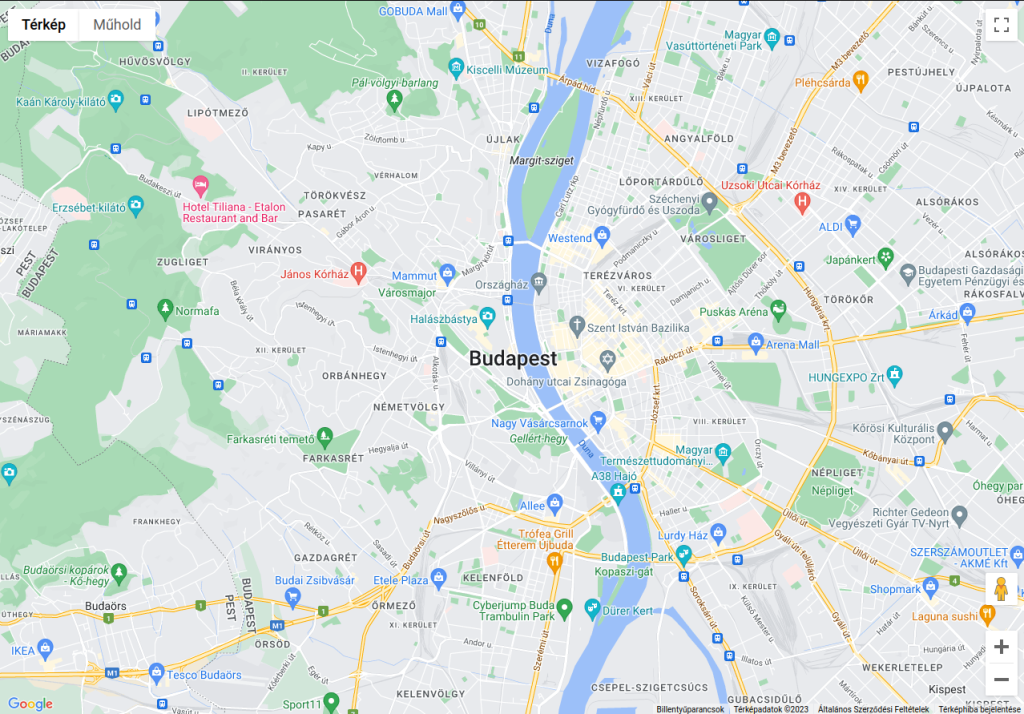






 Nonetheless, this fascinating read will undoubtedly offer valuable insights into the world of ChatGPT and artificial intelligence.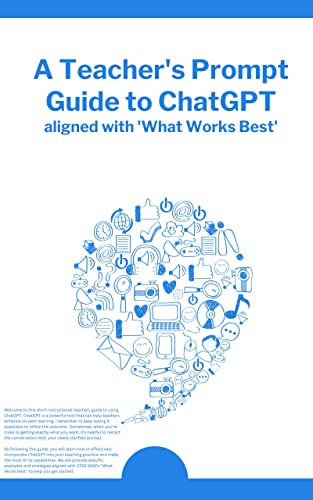
 It made the learning experience much more accessible, especially for readers with visual impairments or learning differences. However, the lack of an X-Ray feature is a minor drawback for those who depend on it for quick reference.