- Go to the giveaway page - Login or make an account if you do not have one - Go to the GOG Homepage - https://www.gog.com/ - Scroll a bit down until you see the banner for the game Iris and the Giant - Its under the "Flash deals" and above "Discover unique indie games" - Wait for the button to appear on the right - Click on the "Yes, and claim the game" button - That's it
We are welcoming everyone to join our discord[discord.gg]. We are more active there on finding giveaways, small or large, and there are daily raffles you can participate.
Tentacular plunges you into the ocean-dwelling hulk of a gigantic, kind-hearted tentacled beast trying to figure out its place in the world.
Raised among humans on the bustling and eccentric island of La Kalma, the time has finally come to unravel the secrets of your mysterious origin while working as the world's strongest handyman. Help your human friends to research a strange and an incredibly powerful energy source through a colossal collection of action-based activities and constructions puzzles, using your titanic tentacles to aid your quest for answers and unlock elements for your very own playground in the creative sandbox mode.
Posted by: xSicKxBot - 04-15-2022, 02:58 AM - Forum: Python
- No Replies
How to Color a Scatter Plot by Category using Matplotlib in Python
Problem Formulation
Given three arrays:
The first two arrays x and y of length n contain the (x_i, y_i) data of a 2D coordinate system.
The third array c provides categorical label information so we essentially get n data bundles (x_i, y_i, c_i) for an arbitrary number of categories c_i.
Question: How to plot the data so that (x_i, y_i) and (x_j, y_j) with the same category c_i == c_j have the same color?
Solution: Use Pandas groupby() and Call plt.plot() Separately for Each Group
To plot data by category, you iterate over all groups separately by using the data.groupby() operation. For each group, you execute the plt.plot() operation to plot only the data in the group.
In particular, you perform the following steps:
Use the data.groupby("Category") function assuming that data is a Pandas DataFrame containing the x, y, and category columns for n data points (rows).
Iterate over all (name, group) tuples in the grouping operation result obtained from step one.
Use plt.plot(group["X"], group["Y"], marker="o", linestyle="", label=name) to plot each group separately using the x, y data and name as a label.
Here’s what that looks like in code:
import pandas as pd

import matplotlib.pyplot as plt # Generate the categorical data

x = [1, 2, 3, 4, 5, 6]

y = [42, 41, 40, 39, 38, 37]

c = ['a', 'b', 'a', 'b', 'b', 'a'] data = pd.DataFrame({"X": x, "Y": y, "Category": c})

print(data) # Plot data by category

groups = data.groupby("Category")

for name, group in groups: plt.plot(group["X"], group["Y"], marker="o", linestyle="", label=name) plt.legend()

plt.show()
Before I show you how the resulting plot looks, allow me to show you the data output from the print() function. Here’s the output of the categorical data:
 X Y Category

0 1 42 a

1 2 41 b

2 3 40 a

3 4 39 b

4 5 38 b

5 6 37 a
Now, how does the colored category plot look like? Here’s how:
If you want to learn more about Matplotlib, feel free to check out our full blog tutorial series:
Java Champions have had an incredibly busy 2018. They have supported their communities by giving over 1400 talks at conferences and user group meetings in over 60 countries. The efforts of these community experts sharing their knowledge around the would influence countless others, professional engin...
[www.indiegala.com] Your favorite Nickelodeon shows, G.I. Joe, Cobra Kai, Street Outlaws, Goosebumps are made into videogames that are now made into giveaways!
[www.indiegala.com] HELLDIVERS™ is a hardcore, cooperative, twin stick shooter. Work together to protect SUPER EARTH and defeat the enemies of mankind in an intense intergalactic war.
NORCO is a Southern Gothic point & click narrative adventure that immerses the player in the sinking suburbs and verdant industrial swamps of a distorted South Louisiana. Your brother Blake has gone missing in the aftermath of your mother's death. In the hopes of finding him, you must follow a fugitive security android through the refineries, strip malls, and drainage ditches of suburban New Orleans.
The games are free to keep until Apr 21st 2022 - 15:00 UTC.
Next week's freebie: Riverbond Amnesia: Rebirth
We are welcoming everyone to join our discord[discord.gg]. We are more active there on finding giveaways, small or large, and there are daily raffles you can participate.
So setting up multisig wallets are pretty easy once you understand how electrum forces you to set it up.
Most tutorials online are saying "go into electrum, under address tab the first address will show your xpub key" I assume in the details where it shows "Public Keys", this key doesnt have a zpub xpub vpub at the beginning, so I automatically assume it wouldn't work. And it doesn't.
I assumed the xpub key was found by opening your wallet in electrum, (already generated a seed) clicking the tab next to "File" labeled "Wallet" which leads you to a master public key. This key has a lowercase z at the beginning.
Ex:zpub6mds5gRVXxbqQ.....asdf
on testnet I got
vpubads0f98...asdf
These keys don't work with multi sig wallets on electrum. Trying these results in: "Wrong key type p2wpkh". This is the only location I was able to find an xpub keys in the electrum application.
After generating several segwit, bip39 wallets and a lot of testing, I have concluded none of the Master Public Keys listed under the "Wallet" Label will work with generating multi sig wallets.
This worked:
So as I can see, in order to get a ( Master Public Key / xpub / mpk ) that will work with multi sig wallets;You open Electrum.
Create a new wallet > Tick Multi Signature Wallet
Select Whatever amount of cosigners, at this point doesn't matter (if you are just trying to figure out your xpub key)
You can create a new seed all together next, or use " I already have a seed"
Once electrum has your seed, at this point, it will give you an xpub key to give to cosigners. Clicking Okay will give you the option to continue adding cosigners Master Public key or adding more seeds.
the difference in Master Public keys listed under the tab "Wallet" > "Information" and the one i get half way going through the multi sig wallet setup?
the obvious is
Wallet>info: zpub098d09d...asdf (has lowercase z)
Multi-sig wallet halfway setup: Zpub039d098f9..asdf (has uppercase Z, actually works for multisig wallet setup)
A lot of the information I was finding pertaining to this was really off. xpub isn't what the beginning should be, it was once upon a time in btc I believe, but is not technically used anymore. Technically now it just means Master Public Key, xpub.
Note* All electrum wallets can send btc to each other, whether 1, 3, or bc1 wallet.
Segwit(bech32) and segwit-p2sh wallets are different. Segwit is the "better" protocol. Segwit wallets start with bc1. They are a lot more common these days. Very widely accepted across the board. Fees with these type of wallets are relatively cheap, compared to what they use to be. I'd like to note, BINANCE doesn't accept segwit, only legacy which starts with a 1 in the address, BEP2, and BSC. I think they are litterally the only exchange that doesn't support lightning servers. Everyone else is moving to it. This causes binances fees for BTC to be REALLLLY high. Trying to send btc in legacy format is costly in fees. Legacy just wasn't made for such a large network. Newer advancements were made, creating smaller bits per address, opening more channels etc. Causes fees to drop drastically.
Cashapp uses lightning servers with segwit-wrapped protocol (bip39) these wallets have a 3 in them.
segwit-in-p2sh / P2SH-P2WPKH (Bip39)
This is the address type that hardware wallets like Trezor or Ledger use. Addresses look like regular P2SH addresses, they start with 3. Without going into too much detail, this uses an old address type and uses segwit to spend from it. The advantage is that virtually all wallets already know how to send coins to this kind of address. One disadvantage is that to spend from those addresses, additional complexity is added to the transaction which makes those transactions slightly bigger (and thus more expensive) than native segwit transactions.
Electrum also supports this kind of addresses but you need to manually import a BIP39 seed with a BIP49 derivation path.
You need to create a BIP39 seed in another wallet or tool and then restore it in Electrum.
but should save the page to a usb stick and use it on a safe offline system (or boot a usb stick live linux with no network, and open the page from file).
When you enter the seed the last word may be wrong (bad checksum), but you just try the others in the section (as described on that dice page). Whatever floats your boat for security paranoia.
When restoring in Electrum select menu File, New/Restore.
Enter a new filename. Next. Choose Standard. Next. Choose "I already have a seed".
Next.
Type your seed words and click options and choose BIP39. You don't absolutely need to get a "valid checksum" message but if you want to use the seed in other BIP39 wallets then it must be valid.
Click Next.
When prompted with a derivation path m/44'/0'/0' change the 44 to 49 but be sure not to alter anything else. Keep the apostrophes. 49 is the code for Segwit! Should be: m/49'/0'/0'
Click Next.
Enter a password for your wallet. This enables wallet file encryption. No password means no encryption, clear text wallet file (not safe).
It will generate your address list. Should all start with 3... These addresses are Segwit and compatible with others on the network now. You won't save on fees when you send to these addresses but you will when you spend from them.
If you use a bad seed just make sure to backup your public and private key list somewhere and you should be good. I generated a bip39 wallet from a segwit generated wallet and was not able to pull the seed out, but was able to backup the keys. So not sure if it will generate the same set of keys every time using this method. Not recommended.
BIP39 was introduced two years after Electrum. BIP39 seeds include a checksum, in order to help users figure out typing errors. However, BIP39 suffers the same shortcomings as early Electrum seed phrases:
A fixed wordlist is still required. Following our recommendation, BIP39 authors decided to derive keys and addresses in a way that does not depend on the wordlist. However, BIP39 still requires the wordlist in order to compute its checksum, which is plainly inconsistent, and defeats the purpose of our recommendation. This problem is exacerbated by the fact that BIP39 proposes to create one wordlist per language. This threatens the portability of BIP39 seed phrases.
BIP39 seed phrases do not include a version number. This means that software should always know how to generate keys and addresses. BIP43 suggests that wallet software will try various existing derivation schemes within the BIP32 framework. This is extremely inefficient and rests on the assumption that future wallets will support all previously accepted derivation methods. If, in the future, a wallet developer decides not to implement a particular derivation method because it is deprecated, then the software will not be able to detect that the corresponding seed phrases are not supported, and it will return an empty wallet instead. This threatens users funds.
Personally I think it's a great idea to have a ledger or card to sign transactions, a wallet on your pc to sign transactions, with the third wallet dormant somewhere in case you lose 1 of the first 2 wallets. The setup is kind of ridiculous right now but the build is solid. Want to develop some software to work with multi sig wallets and pgp keys, fully signing and identifying all parties of a transaction. Whether 2, 3 people or 100. (Although most transactions will only need 2 sides and maybe a median). With lightning networks being accepted by the majority now, BTC is on the brink of big things with the right, easy to use, setup getting out.
Hope this helps some people! I've done about 12 hours of research today and testing. If anyone would like to donate via
ltc: ltc1qv25xyaf9kwe4fnd6f8qaczffj6candrujqcp5r
bch: qzsz66646zxsy3k9mpt2880pqjgr7prp75qj9yrnvr
btc: bc1q26xgshdy6ccgknh3eeh3z2nhy53wgn8rt8sgm5
xmr: 45ajoUpndu3Fj8vShiZ98Ad4jyse732tdA4yHWEx4RfF17Jt15WJGm9j6JS9NDKvGuebJ5HSaXB8KCeKdBxiKAcVPXS2irL
By Guess Blogger Deepak Vohra Java Shell (or JShell) is a new tool introduced in Java 9 for running standalone code snippets. JShell in NetBeans is explored in six articles. The first article introduces JShell with NetBeans including how to access the JShell. JShell-only commands such as /list and /...
Posted by: xSicKxBot - 04-14-2022, 10:19 AM - Forum: Python
- No Replies
How to Use Pandas Rolling – A Simple Illustrated Guide
This article will demonstrate how to use a pandas dataframe method called rolling().
What does the pandas.DataFrame.rolling() method do?
In short, it performs rolling windows calculations.
It is often used when working with time-series data or signal processing. I will shortly dive into a few practical examples to clarify what this means in practice.
The method will be given a parameter that specifies how big the window the desired calculations should be performed in.
A simple example of using time series data could be that each row of a pandas dataframe represents a day with some values.
Let’s say that the desired window size is five days. The rolling method is given a five as input, and it will perform the expected calculation based on steps of five days.
Before an example of this, let’s see the method, its syntax, and its parameters.
If an integer, the fixed number of observations is used for each window.
If an offset, the time period of each window. Each window will be variable-sized based on the observations included in the time period. This is only valid for datetime-like indexes.
If a BaseIndexer subclass, the window boundaries are based on the defined get_window_bounds() method. Additional rolling keywords argument, namely min_periods, center, and closed will be passed to get_window_bounds().
min_periods
min_periods: int, default None
This is the minimum number of observations in the window required to have a value.
The data I will be working with for this tutorial is historical data for a stock, the amazon stock.
I use the python package yfinance to import the data. I will use data starting from 2021-04-01 and running one year forward in time.
The data only includes trading days, i.e., days when the stock market was open.
# Get the stock data from Yahoo finance

AmazonData1y = yfinance.Ticker("AMZN").history(period='1y', actions=False, end='2022-04-01')

display(AmazonData1y.head(20))
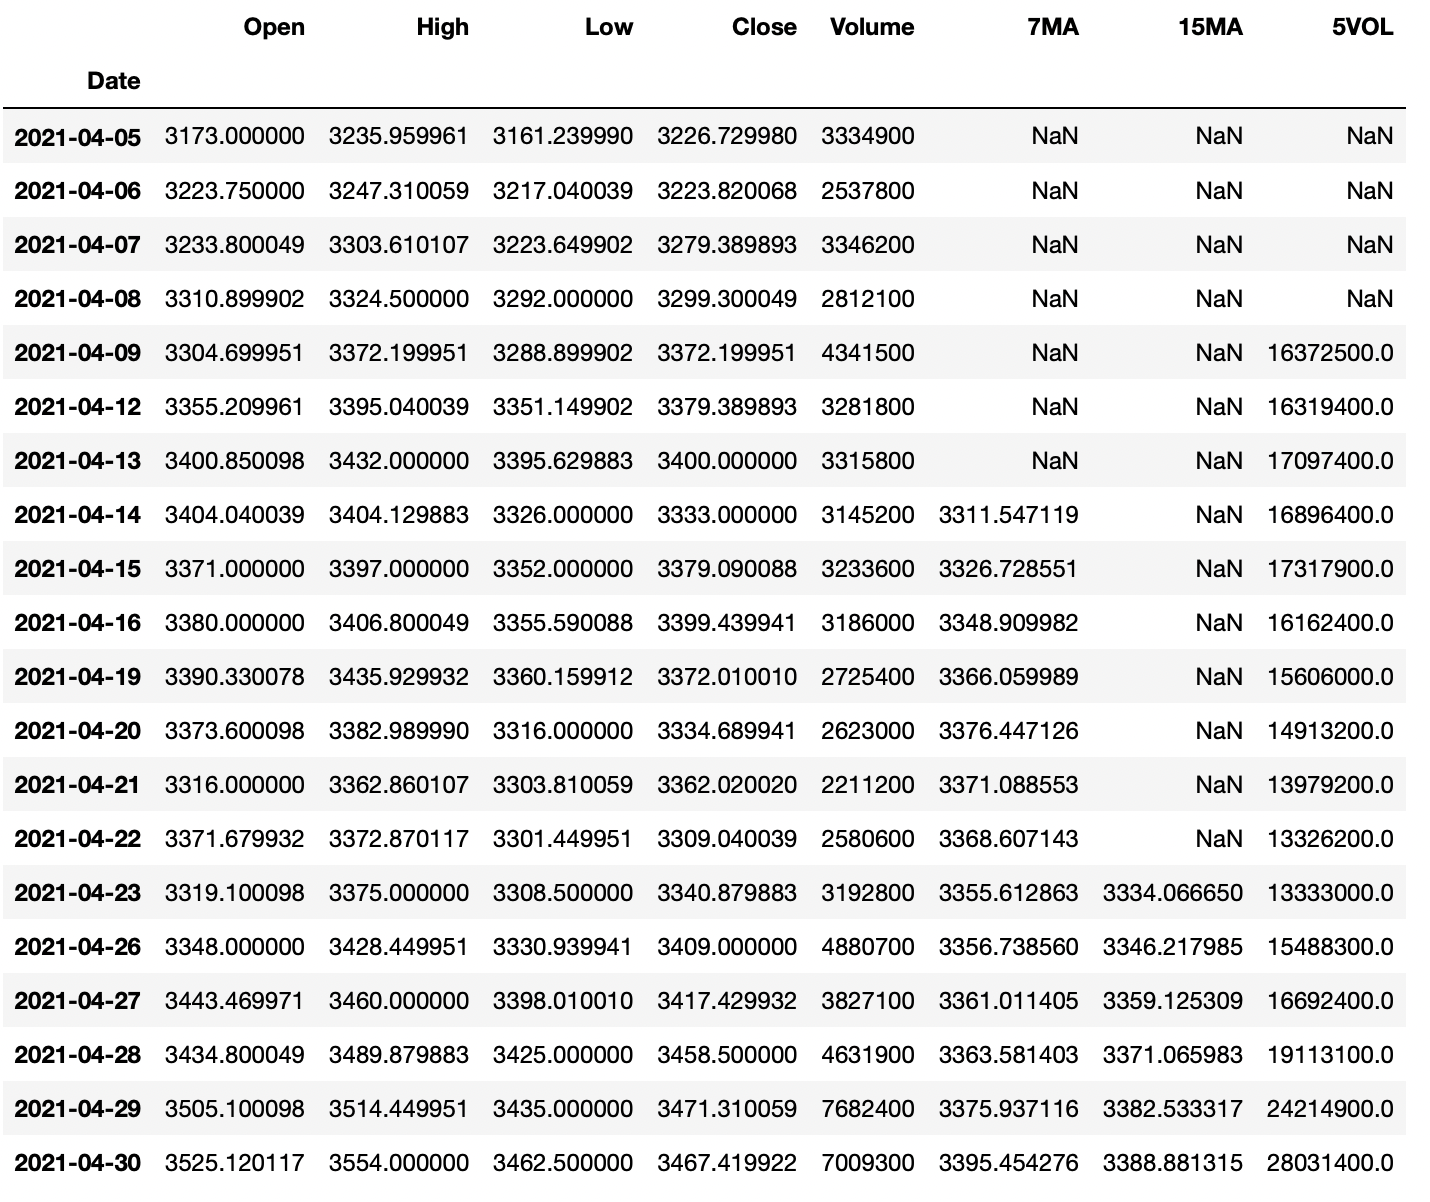
The resulting dataframe contains data about the opening price, the highest price, the lowest price, the closing price, and the trading volume for each day.
Calculating moving averages
The first calculations using the rolling method I will do are some different moving averages values. They are often applied in stock analysis.
A moving average value is a statistic that captures the average change in a data series over time. (source)
Let’s calculate the moving averages for seven days and 15 days for the stock closing price and add those values as new columns to the existing amazon dataframe.
They are named 'MA7' and 'MA15'.
# Calculating the 7 and 15 day moving averages based on closing price

# and adding them as new columns

AmazonData1y['7MA'] = AmazonData1y['Close'].rolling(7).mean()

AmazonData1y['15MA'] = AmazonData1y['Close'].rolling(15).mean() display(AmazonData1y.head(20))
Since there is no data before 2021-04-01, no seven-day moving average can be calculated before 2021-04-13 and no 15-day moving average before 2021-04-23.
Calculating the Sum of Trading Volume
Let’s now instead use the rolling method to calculate the sum of the volume from the last five trading days to spot if there was any spike in volume.
It is done in the same way as for the moving average, but here the sum() method is used together with the rolling method instead of the mean() method.
I will also add this as a new column to the existing Amazon dataframe.
# Calculating 5 day volume using rolling

AmazonData1y['5VOL'] = AmazonData1y['Volume'].rolling(5).sum() display(AmazonData1y.head(20))
This metric might not be the most useful but it is a good way to explain how you could use the rolling method together with the sum() method.
Using rolling() with Aggregation
If combining the rolling() method with the aggregation method agg(), it is easy to perform rolling calculations on multiple columns simultaneously.
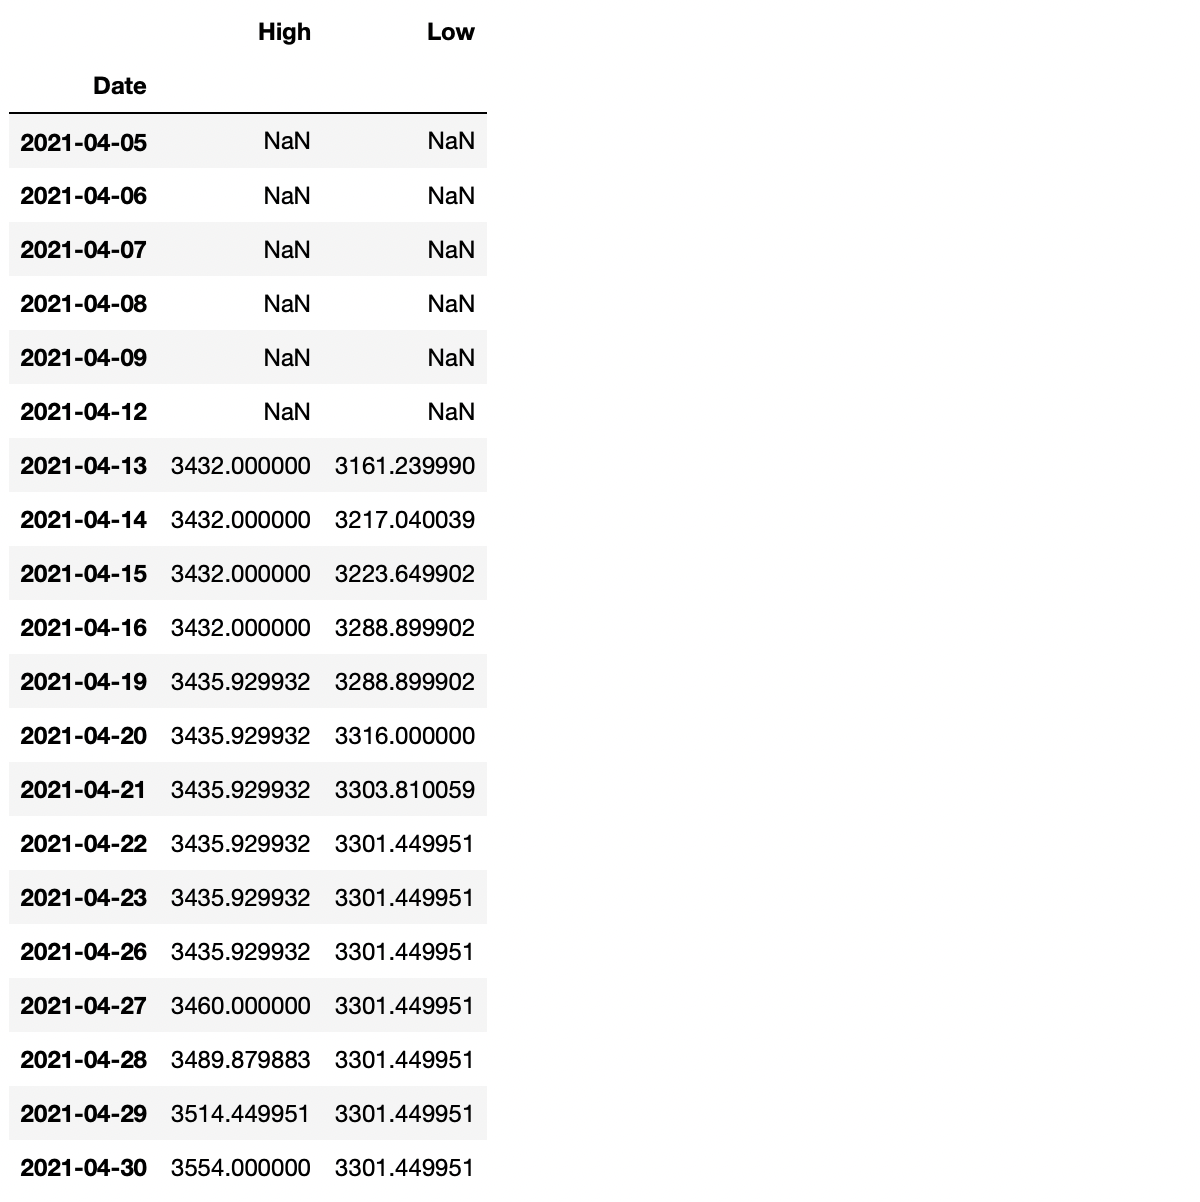
Say that I would like to find the highest high and the lowest low for the last seven days.
# Performing rolling calculations on multiple columns at the

# same time using .agg()

SevenHighAndLow = AmazonData1y.rolling(7).agg({'High': 'max', 'Low': 'min'}) display(SevenHighAndLow.head(20))
Plotting the Values
This part will be included to visualize the value calculated. It’s a bit more appealing than simply just looking at columns of a dataframe.
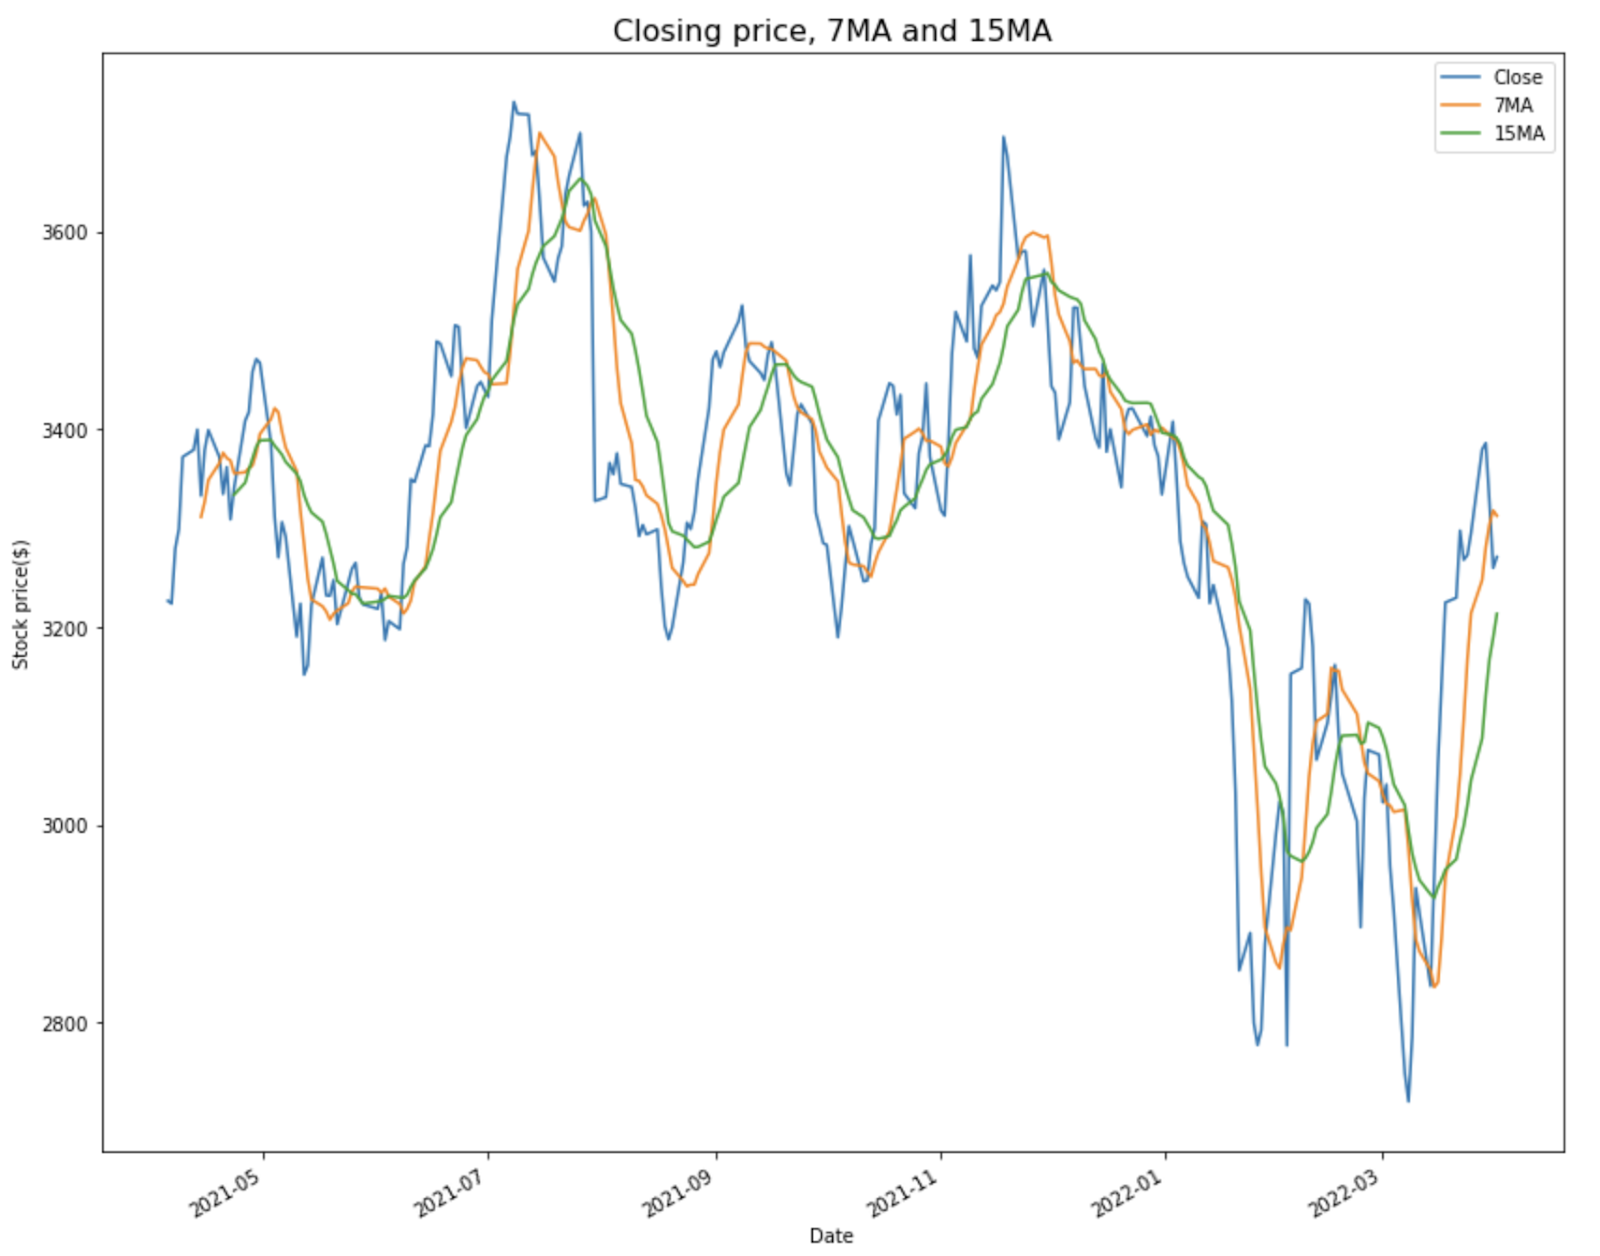
First, let’s plot the calculated moving averages values alongside the closing price.
# Plotting the closing price with the 7 and 15 day moving averages

AmazonData1y.plot(y=['Close', '7MA', '15MA'], kind='line', figsize=(14,12)) plt.title('Closing price, 7MA and 15MA', fontsize=16)

plt.xlabel('Date')

plt.ylabel('Stock price($)')

plt.show()
And then the accumulated 5 day volume alongside the closing price.
# Plotting the closing price alongside the 5 day volume

AmazonData1y.plot(y=['Close', '5VOL'], secondary_y='5VOL', kind='line', ylabel='Stock Price ($)', figsize=(14,12)) plt.title('Closing price and 5 day accumulated volume', fontsize=16)

plt.xlabel('Date')

plt.ylabel('Volume')

plt.show()
Summary
This was a short tutorial on applying the rolling() method on a pandas dataframe using some statistics.
The goal of this article was to demonstrate some simple examples of how the rolling() method works, and I hope that it did accomplish that goal.
The rolling() method can be used for most statistics calculations, so try and explore it using other methods than those used for this article.



 Question: How to plot the data so that


 A moving average value is a statistic that captures the average change in a data series over time. (