If you’ve already learned how to make basic 3d plots in maptlotlib and want to take them to the next level, then look no further. In this article, I’ll teach you how to create the two most common 3D plots (surface and wireframe plots) and a step-by-step method you can use to create any shape you can imagine.
In addition to import matplotlib.pyplot as plt and calling plt.show(), to create a 3D plot in matplotlib, you need to:
Import the Axes3D object
Initialize your Figure and Axes3D object
Get some 3D data
Plot it using Axes notation
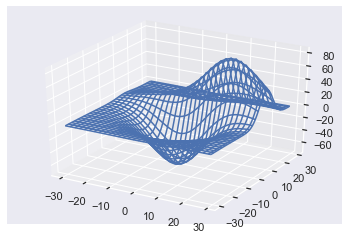
Here’s a wireframe plot:
# Standard import

import matplotlib.pyplot as plt # Import 3D Axes

from mpl_toolkits.mplot3d import axes3d # Set up Figure and 3D Axes

fig = plt.figure()

ax = fig.add_subplot(111, projection='3d') # Get some data

X, Y, Z = axes3d.get_test_data(0.1) # Plot using Axes notation

ax.plot_wireframe(X, Y, Z)

plt.show()
Try It Yourself on our interactive Python shell (and check out the file 'plot.png'):
Changing the plot call to ax.plot_surface(X, Y, Z) gives
Great! You’ve just created your first 3D wireframe and surface plots. Don’t worry if that was a bit fast; let’s dive into a more detailed example.
But first, note that your plots may look different to mine because I use the seaborn style throughout. You can set this by installing the seaborn library and calling the set function at the top of your code.
import seaborn as sns; sns.set()
Matplotlib 3D Plot Example
The four steps needed to create advanced 3D plots are the same as those needed to create basic ones. If you don’t understand those steps, check out my article on how to make basic 3D plots first.
The most difficult part of creating surface and wireframe plots is step 3: getting 3D data. Matplotlib actually includes a helper function axes3d.get_test_data() to generate some data for you. It accepts a float and, for best results, choose a value between 0 and 1. It always produces the same plot, but different floats give you different sized data and thus impact how detailed the plot is.
However, the best way to learn 3D plotting is to create custom plots.
At the end of step 3, you want to have three numpy arraysX, Y and Z, which you will pass to ax.plot_wireframe() or ax.plot_surface(). You can break step 3 down into four steps:
Define the x-axis and y-axis limits
Create a grid of XY-points (to get X and Y)
Define a z-function
Apply the z-function to X and Y (to get Z)
In matplotlib, the z-axis is vertical by default. So, the ‘bottom’ of the Axes3D object is a grid of XY points. For surface or wireframe plots, each pair of XY points has a corresponding Z value. So, we can think of surface/wireframe plots as the result of applying some z-function to every XY-pair on the ‘bottom’ of the Axes3D object.
Since there are infinitely many numbers on the XY-plane, it is not possible to map every one to a Z-value. You just need an amount large enough to deceive humans – anything above 50 pairs usually works well.
To create your XY-points, you first need to define the x-axis and y-axis limits. Let’s say you want X-values ranging from -5 to +5 and Y-values from -2 to +2. You can create an array of numbers for each of these using the np.linspace() function. For reasons that will become clear later, I will make x have 100 points, and y have 70.
x = np.linspace(-5, 5, num=100)

y = np.linspace(-2, 2, num=70)
Both x and y are 1D arrays containing num equally spaced floats in the ranges [-5, 5] and [-2, 2] respectively.
Since the XY-plane is a 2D object, you now need to create a rectangular grid of all xy-pairs. To do this, use the numpy function np.meshgrid(). It takes n 1D arrays and turns them into an N-dimensional grid. In this case, it takes two 1D arrays and turns them into a 2D grid.
X, Y = np.meshgrid(x, y)
Now you’ve created X and Y, so let’s inspect them.
print(f'Type of X: {type(X)}')

print(f'Shape of X: {X.shape}\n')

print(f'Type of Y: {type(Y)}')

print(f'Shape of Y: {Y.shape}')
Type of X: <class 'numpy.ndarray'>

Shape of X: (70, 100) Type of Y: <class 'numpy.ndarray'>

Shape of Y: (70, 100)
Both X and Y are numpy arrays of the same shape: (70, 100). This corresponds to the size of y and x respectively. As you would expect, the size of y dictates the height of the array, i.e., the number of rows and the size of x dictates the width, i.e., the number of columns.
Note that I used lowercase x and y for the 1D arrays and uppercase X and Y for the 2D arrays. This is standard practice when making 3D plots, and I use it throughout the article.
Now you’ve created your grid of points; it’s time to define a function to apply to them all. Since this function outputs z-values, I call it a z-function. Common z-functions contain np.sin() and np.cos() because they create repeating, cyclical patterns that look interesting when plotted in 3D. Additionally, z-functions usually combine both X and Y variables as 3D plots look at how all the variables interact.
# Define z-function with 2 arguments: x and y

def z_func(x, y): return np.sin(np.cos(x) + y) # Apply to X and Y

Z = z_func(X, Y)
Here I defined a z-function that accepts 2 variables – x and y – and is a combination of np.sin() and np.cos() functions. Then I applied it to X and Y to get the Z array. Thanks to numpy broadcasting, python applies the z-function to every XY pair almost instantly and saves you from having to write a wildly inefficient for loop.
Note that Z is the same shape and type as both X and Y.
print(f'Type of Z: {type(Z)}')

print(f'Shape of Z: {Z.shape}')
Type of Z: <class 'numpy.ndarray'>

Shape of Z: (70, 100)
Now that you have got your data, all that is left to do is make the plots. Let’s put all the above code together:
# Set up Figure and 3D Axes

fig = plt.figure()

ax = fig.add_subplot(111, projection='3d') # Create x and y 1D arrays

x = np.linspace(-5, 5, num=100)

y = np.linspace(-2, 2, num=70) # Create X and Y 2D arrays

X, Y = np.meshgrid(x, y) # Define Z-function

def z_func(x, y): return np.sin(np.cos(x) + y) # Create Z 2D array

Z = z_func(X, Y) # Plot using Axes notation

ax.plot_wireframe(X, Y, Z)

# Set axes lables

ax.set(xlabel='x', ylabel='y', zlabel='z')

plt.show()
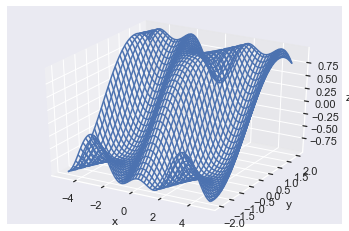
Great, I found the above plot by playing around with different z-functions and think it looks pretty cool! Z-functions containing np.log(), np.exp(), np.sin(), np.cos() and combinations of x and y usually lead to interesting plots – I encourage you to experiment yourself.
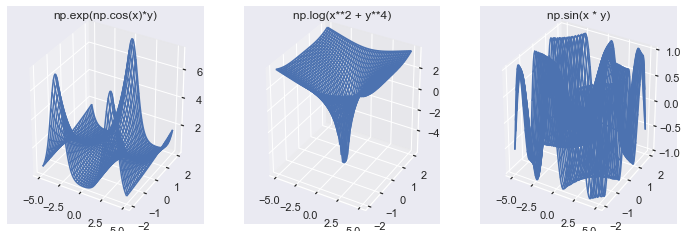
Now I’ll create 3 different z-functions with the same X and Y as before and create a subplot of them so you can see the differences.
# Set up Figure and Axes

fig, axes = plt.subplots(1, 3, subplot_kw=dict(projection='3d'), figsize=plt.figaspect(1/3)) # Create 3 z-functions

def z_1(x, y): return np.exp(np.cos(x)*y)

def z_2(x, y): return np.log(x**2 + y**4)

def z_3(x, y): return np.sin(x * y) # Create 3 Z arrays Z_arrays = [z_1(X, Y), z_2(X, Y), z_3(X, Y)]

# Titles for the plots

z_func_names = ['np.exp(np.cos(x)*y)', 'np.log(x**2 + y**4)', 'np.sin(x * y)'] # Plot all 3 wireframes

for Z_array, z_name, ax in zip(Z_arrays, z_func_names, axes): ax.plot_wireframe(X, Y, Z_array) ax.set(title=z_name)

plt.show()
I think all of these images demonstrate the power of 3D plotting, and I hope they have encouraged you to create your own.
Now you know how to create any surface or wireframe plot with your data. But so far, you have only used the default settings. Let’s modify them using the available keyword arguments.
Matplotlib 3D Plot Wireframe
To make a wireframe plot, call ax.plot_wireframe(X, Y, Z). These plots give you an overview of the surface. Plus, you can see through them to more easily identify peaks and troughs that may otherwise be hidden.
A wireframe plot works by only plotting a sample of the data passed to it. You can modify how large the samples are with 4 keyword arguments:
rstride and cstride, or
rcount and ccount
The r and c stand for row and column respectively. The difference between them is similar to the difference between np.arange() and np.linspace().
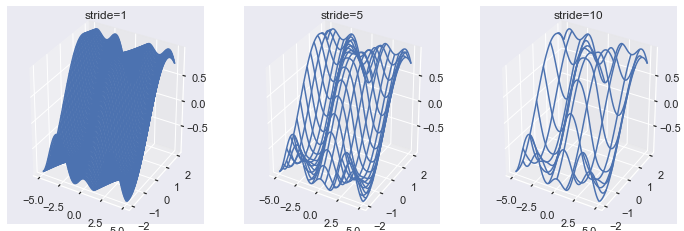
The stride arguments default to 1 and set the step sizes between each sampled point. A stride of 1 means that every value is chosen, and a stride of 10 means that every 10th value is chosen. In this way, it is similar to np.arange() where you select the step size. A larger stride means fewer values are chosen, so your plot renders faster and is less detailed.
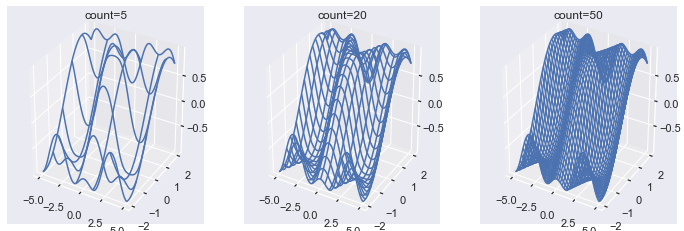
The count arguments default to 50 and set the number of (equally spaced) rows/columns sampled. A count of 1 means you use 1 row/column, and a count of 100 means you use 100. In this way, it is similar to np.linspace() where you select the total number of values with the num keyword argument. A larger count means more values are chosen, so your plot renders slower and is more detailed.
The matplotlib docs say that you should use the count arguments. However, both are still available, and it doesn’t look like the stride arguments will be depreciated any time soon. Note, though, that you cannot use both count and stride, and if you try to do so, it’s a ValueError.
By setting any of the keyword arguments to 0, you do not sample data along that axis. The result is then a 3D line plot rather than a wireframe.
To demonstrate the differences between different counts or strides, I’ll create a subplot with the same X, Y and Z arrays as the first example but with different stride and count values.
fig, axes = plt.subplots(nrows=1, ncols=3, subplot_kw=dict(projection='3d'), figsize=plt.figaspect(1/3))

# Same as first example

x = np.linspace(-5, 5, num=100)

y = np.linspace(-2, 2, num=70)

X, Y = np.meshgrid(x, y) def z_func(x, y): return np.sin(np.cos(x) + y)

Z = z_func(X, Y) # Define different strides

strides = [1, 5, 10] for stride, ax in zip(strides, axes.flat): ax.plot_wireframe(X, Y, Z, rstride=stride, cstride=stride) ax.set(title=f'stride={stride}') plt.show()
Here you can see that a larger stride produces a less detailed wireframe plot. Note that stride=1 is the default and is incredibly detailed for a plot that is supposed to give a general overview of the data.
fig, axes = plt.subplots(nrows=1, ncols=3, subplot_kw=dict(projection='3d'), figsize=plt.figaspect(1/3)) counts = [5, 20, 50] for count, ax in zip(counts, axes.flat): # Use same data as the above plots ax.plot_wireframe(X, Y, Z, rcount=count, ccount=count) ax.set(title=f'count={count}') plt.show()
Here you can see that a larger count produces a more detailed wireframe plot. Again note that the default count=50 produces a very detailed plot.
To make a surface plot call ax.plot_surface(X, Y, Z). Surface plots are the same as wireframe plots, except that spaces in between the lines are colored. Plus, there are some additional keyword arguments you can use, which can add a ton of value to the plot.
First, let’s make the same plots as above with the default surface plot settings and different rcount and ccount values.
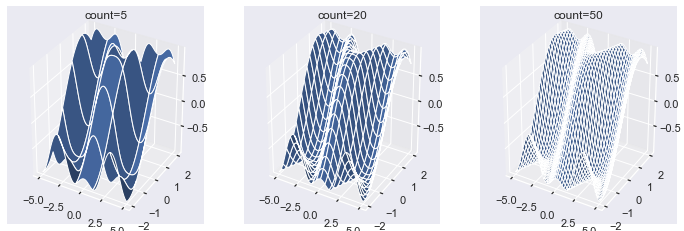
fig, axes = plt.subplots(nrows=1, ncols=3, subplot_kw=dict(projection='3d'), figsize=plt.figaspect(1/3)) counts = [5, 20, 50] for count, ax in zip(counts, axes.flat): # Use same data as the above plots surf = ax.plot_surface(X, Y, Z, rcount=count, ccount=count) ax.set(title=f'count={count}') plt.show()
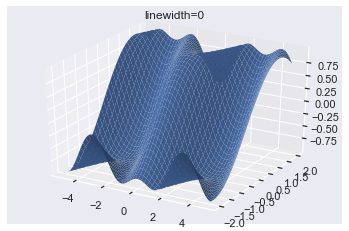
In contrast to wireframe plots, the space in between each line is filled with the color blue. Note that the plots get whiter as the count gets larger. This is because the lines are white, and, as the count increases, there are more lines on each plot. You can modify this by setting the linewidth or lw argument to a smaller number such, as 0.1 or even 0.
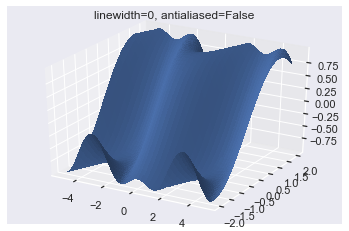
Much nicer! Now you can see the color of the plot rather than the color of the lines. It is possible to almost completely remove the lines by setting antialiased=False.
Antialiasing removes noise from data and smooths out images. By turning it off, the surface is less smooth, and so you can’t see the lines as easily.
Now the surface is slightly less smooth, and so you can’t see the lines.
Maptlotlib 3D Surface Plot Cmap
Arguably the most crucial keyword argument for surface plots is cmap which sets the colormap. When you look at a surface plot from different angles, having a colormap helps you understand which parts of the surface are where. Usually, you want high points to be one color (e.g., orange) and low points to be another (e.g., black). Having two distinct colors is especially helpful if you look at a plot from different angles (which I will show you how to do in a moment).
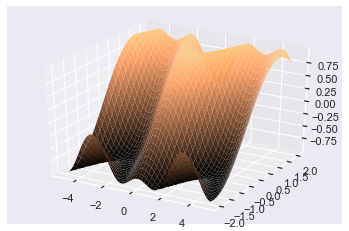
The colormap copper maps large z-values to orange and smaller ones to black.
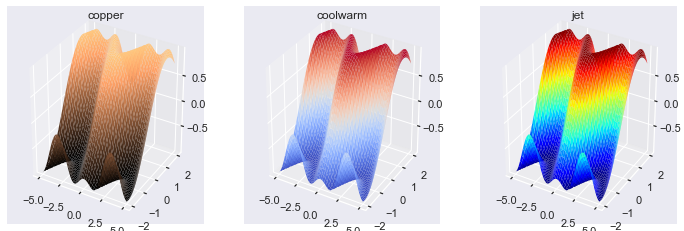
Now I’ll use 3 different and commonly used colormaps for the same plot to give you an idea of how color can help and (massively) hinder your plots.
fig, axes = plt.subplots(nrows=1, ncols=3, subplot_kw=dict(projection='3d'), figsize=plt.figaspect(1/3)) cmaps = ['copper', 'coolwarm', 'jet'] for cmap, ax in zip(cmaps, axes): ax.plot_surface(X, Y, Z, lw=0, cmap=cmap) ax.set(title=f'{cmap}')

plt.show()
The coolwarm colormap works well if you want to highlight extremely high and extremely low points. This non-technical paper defines a colormap similar to coolwarm and argues it should be the default cmap for all data science work.
The jet colormap is well known and is a terrible choice for all of your plotting needs. It contains so many colors that it is hard for a human to know which corresponds to high, low, or middle points. I included it as an example here but urge you to never use it in any of your plots.
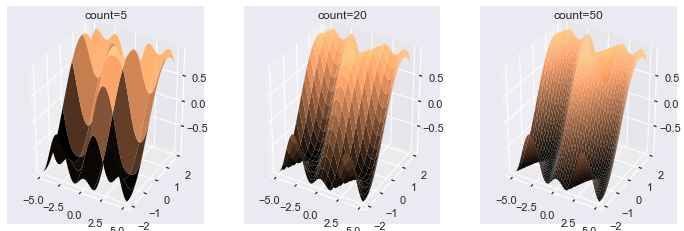
Now let’s look at how the count and stride arguments can affect the color of your surface plots. For brevity, I will just make one subplot demonstrating different rccount and ccount sizes and leave the reader to experiment with rstride and cstride.
fig, axes = plt.subplots(nrows=1, ncols=3, subplot_kw=dict(projection='3d'), figsize=plt.figaspect(1/3)) counts = [5, 20, 50] for count, ax in zip(counts, axes.flat): # Use same data as the above plots ax.plot_surface(X, Y, Z, rcount=count, ccount=count, cmap='copper', lw=0) ax.set(title=f'count={count}')

plt.show()
If you pass a lower value to the count keyword arguments, there are fewer areas that can be colored. As such, the colors have much more distinct bands when you set the count keyword arguments to smaller values. The change in color is much smoother in the plots that have large count arguments.
Matplotlib 3D Plot Colorbar
Adding a colorbar to a 3D surface plot is the same as adding them to other plots.
The simplest method is to save the output of ax.plot_surface() in a variable such as surf and pass that variable to plt.colorbar().
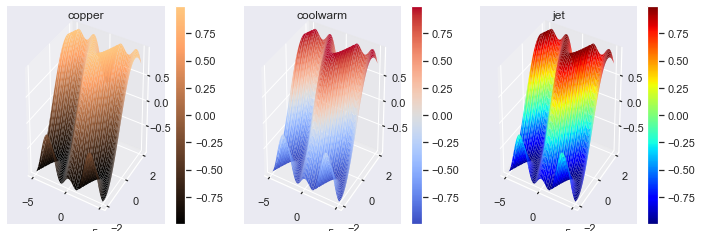
Here’s an example using the three different colormaps from before.
fig, axes = plt.subplots(nrows=1, ncols=3, subplot_kw=dict(projection='3d'), figsize=plt.figaspect(1/3)) cmaps = ['copper', 'coolwarm', 'jet'] for cmap, ax in zip(cmaps, axes): # Save surface in a variable: surf surf = ax.plot_surface(X, Y, Z, lw=0, cmap=cmap) # Plot colorbar on the correct Axes: ax fig.colorbar(surf, ax=ax) ax.set(title=f'{cmap}')

plt.show()
It’s essential to provide a colorbar for any colored plots you create, especially if you use different colormaps. Remember that colorbar() is a Figure (not Axes) method, and you must use the ax keyword argument to place it on the correct Axes.
Now, let’s see why colormaps are so crucial by rotating the surface plots and viewing them from different angles.
Matplotlib 3D Plot View_Init
One way to rotate your plots is by using the magic command %matplotlib notebook at the top of your Jupyter notebooks. If you do this, all your plots appear in interactive windows. If instead, you use %matplotlib inline (the default settings), you have to rotate your plots using code.
Two attributes that control the rotation of a 3D plot: ax.elev and ax.azim, which represent the elevation and azimuthal angles of the plot, respectively.
The elevation is the angle above the XY-plane and the azimuth (don’t worry, I hadn’t heard of it before either) is the counter-clockwise rotation about the z-axis. Note that they are properties of the Axes3D object and so you can happily create subplots where each has a different angle.
Let’s find the default values.
fig = plt.figure()

ax = plt.axes(projection='3d') print(f'The default elevation angle is: {ax.elev}')

print(f'The default azimuth angle is: {ax.azim}')
The default elevation angle is: 30

The default azimuth angle is: -60
You can see that the defaults are 30 and -60 degrees for the elevation and azimuth, respectively.
You can set them to any float you want, and there are two ways to do it:
Reassign the ax.azim and ax.elev attributes, or
Use the ax.view_init(elev, azim) method
Here’s an example with method 1.
# Same as usual

fig = plt.figure()

ax = plt.axes(projection='3d')

ax.plot_surface(X, Y, Z, lw=0, cmap='copper')

# Set axis labels so you know what you are looking at

ax.set(xlabel='x', ylabel='y', zlabel='z') # Reassign rotation angles to 0

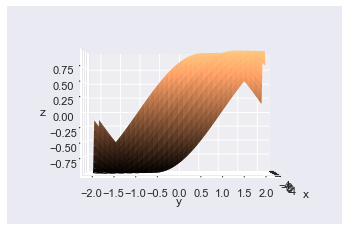
ax.azim, ax.elev = 0, 0

plt.show()
Here I set both angles to 0, and you can see the y-axis at the front, the x-axis at the side, and the z-axis as vertical.
I’ll now create the same plot using the ax.view_init() method, which accepts two floats: the elevation and azimuth.
# Same as usual

fig = plt.figure()

ax = plt.axes(projection='3d')

ax.plot_surface(X, Y, Z, lw=0, cmap='copper')

# Set axis labels so you know what you are looking at

ax.set(xlabel='x', ylabel='y', zlabel='z') # Reassign rotation angles to 0

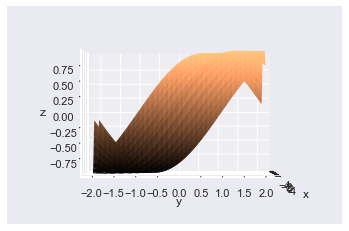
ax.view_init(elev=0, azim=0)

plt.show()
Excellent! This plot looks identical to the one above, but I used the ax.view_init() method instead. If you just want to change one of the angles, only pass one of the keyword arguments.
# Same as usual

fig = plt.figure()

ax = plt.axes(projection='3d')

ax.plot_surface(X, Y, Z, lw=0, cmap='copper')

# Set axis labels so you know what you are looking at

ax.set(xlabel='x', ylabel='y', zlabel='z') # Set elevation to 90 degrees

ax.view_init(elev=90)

plt.show()
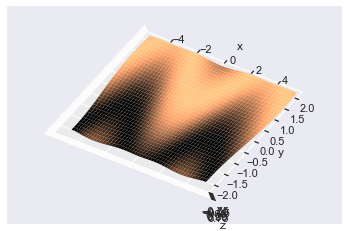
Here I set the elevation to 90 degrees but left the azimuth with its default value. This demonstrates one more reason why colormaps are important: you can infer the shape of the surface from the color (black is low, light is high).
Conclusion
Now you know how to create the most critical 3D plots: wireframe and surface plots.
You’ve learned how to create custom 3D plot datasets using np.linspace(), np.meshgrid() and z-functions. Plus, you can create them with varying degrees of accuracy by modifying the count and stride keyword arguments.
You can make surface plots of any color and colormap and modify them so that the color of the lines doesn’t take over the plot. Finally, you can rotate them by setting the ax.azim or ax.elev attributes to a float of your choice and even use the ax.view_init() method to do the same thing.
Congratulations on mastering these plots! Creating other advanced ones such as contour, tri-surface, and quiver plots for you will be easy. You know all the high-level skills; you just need to go out there and practice.
Where To Go From Here?
Do you wish you could be a programmer full-time but don’t know how to start?
Check out the pure value-packed webinar where Chris – creator of Finxter.com – teaches you to become a Python freelancer in 60 days or your money back!
It doesn’t matter if you’re a Python novice or Python pro. If you are not making six figures/year with Python right now, you will learn something from this webinar.
These are proven, no-BS methods that get you results fast.
This webinar won’t be online forever. Click the link below before the seats fill up and learn how to become a Python freelancer, guaranteed.
Scratchy Spring Sale Week 2: Adult Only Comic Sale
Scratchy Spring Sale Day 7: Adult Only Comic Sale, all titles -35%
[www.indiegala.com] Be on the look-out for some huge discounts on your favorite games & ebooks + a Scratch Card with a FREE secret Steam game for every store purchase.
There is a new Humble Bundle of interest to game developers, the Humble Applied Math Productivity by Mercury Learning bundle is a collection of mathematics related e-books. As with all Humble Bundles, this one is organized into tiers, including:
1$ Tier
· Dimensional Analysis for Unit Conversion Using MATLAB
· Numeric Methods in Engineering and Science
· Algebra Essentials
· Mathematical Physics: An Introduction
· Foundations of Physics
· Research Methods for Information Systems
· Linear Algebra
8$ Tier
· Essentials of Modern Algebra
· RFModule
· The Special Theory of Relativity
· Foundations of Mathematics: Algebra, Geometry, Trigonometry and Calculus
· Mathematical Methods for Physics
· Excel Functions and Formulas
· Applied Linear Algebra and Optimization using MATLAB
· Finite Element Analysis A Primer
· Optimization using Linear Programming
15$ Tier
· Multivariable Vector Calculus
· Structural Steel Design
· Mathematics for Computer Graphics and Game Programming
· Geometry Creation and Import
· Flight Science
· Direct Energy Conversion Technologies
· Cluster Analysis and Data Mining
· Commutative Algebra
· Comsol: Heat Transfer Models
As with all Humble Bundles, you decide how your money is allocated, between Humble, charity, the publisher and if you so choose (and thanks so much if you do!) to support GFS if purchased using this link. You can learn more about this bundle in the video below.
Raw Fury announces Kingdom Two Crowns: Dead Lands for mobile
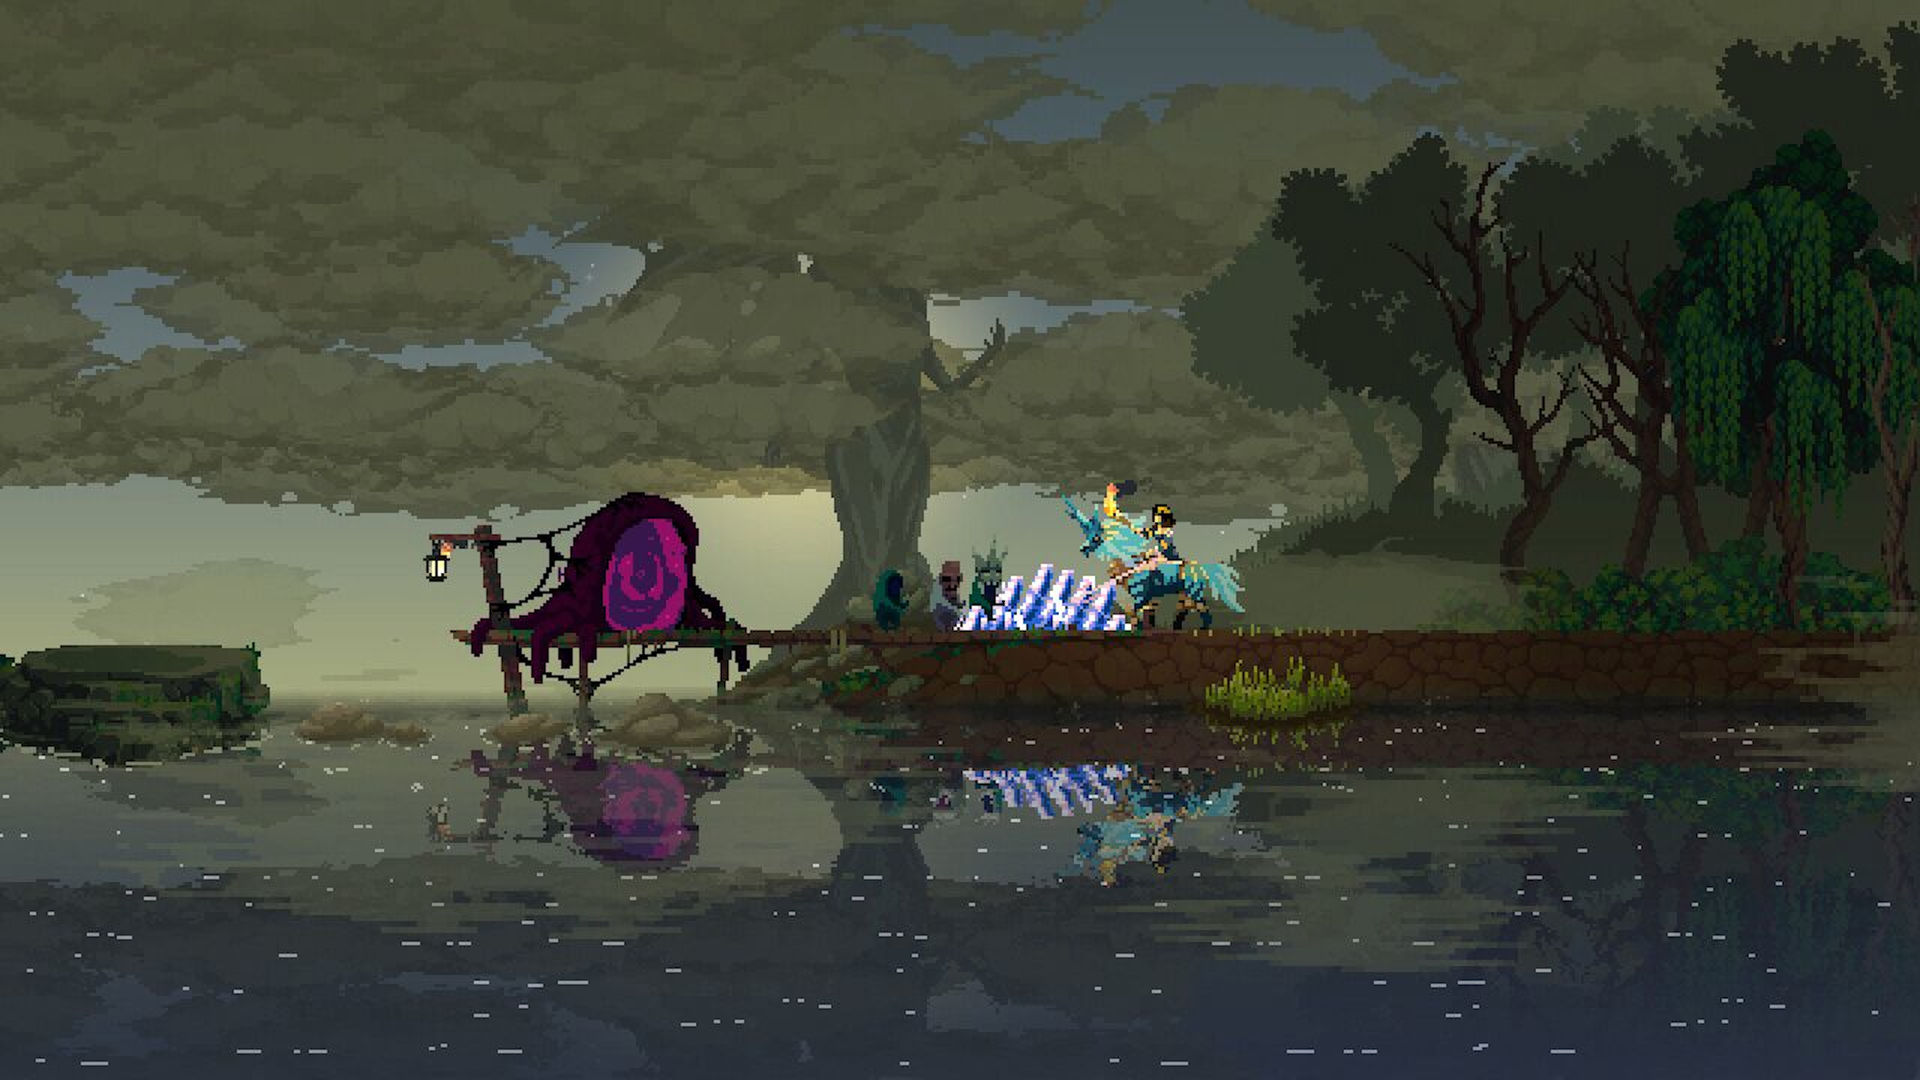
Raw Fury has announced a big expansion for Kingdom Two Crowns that features characters from the hit Metroidvania Bloodstained: Ritual of the Night. It’s called Dead Lands, and it allows you to play as a few of your favourite characters from Bloodstained on a wide variety of new mounts. This also marks a new feature for the series, which allows you to change your mount on the fly.
Each of the mounts have different abilities too, including a beetle that lays traps, an undead mount that summons barriers, and the horse Gamigin, which has a powerful charge attack. Perhaps more exciting than this is the new ability to swap between the four different monarchs available as part of this expansion: Miriam, Zangetsu, Gebel, and Alfred. Each monarch has its own unique trait, allowing you to adapt your approach on the fly like never before.
The best news is that the Dead Lands expansion will launch entirely for free, along with the mobile version of Two Crowns, on April 28. The mobile version costs $8.99 (£8.99) and includes new co-op modes, a brand new touch control scheme, and controller support.
In other Raw Fury-related news, the publisher is holding a big spring sale to celebrate the sunshine. Many of its excellent titles are available at huge reductions across the App Store and Google Play. This includes the likes of strategy great Bad North, cyberpunk point-and-click adventure Whispers of a Machine, and Metroidvania Dandara, which recently saw a big content drop itself.
The prices across the board appear to have dropped by roughly 50%, which is pretty substantial. In a disappointing move, Kingdom: New Lands hasn’t seen any discount in price, which seems a bit surprising given that the sequel, Kingdom Two Crowns, launches in just over a week on April 28. You’d think this would be a good opportunity to pick up a few new users.
You can pre-register for Kingdom Two Crowns right now on Google Play or pre-order it on the App Store. You can also check out Raw Fury’s sale on iOS or Android and grab yourself a bargain.
Apple working with ‘American Idol’ to use iPhones to finish the season
By Amber Neely Monday, April 20, 2020, 01:06 pm PT (04:06 pm ET)
ABC and FremantleMedia are bringing American Idol back to TV with a new twist —the contestants will film themselves at home using the latest iPhones.
American Idol, like many other shows, was shut down when the ongoing pandemic forced social distancing. The audience-centric, live show had initially planned to delay the show until social distancing restrictions had been lifted, but found that the idea didn’t feel right. That’s when the show decided to get creative.
American Idol show-runner Trish Kinane, who is also the president of Entertainment Programming for FremantleMedia, had to come up with a clever solution to working around lockdown restrictions.
Kinane and a team of nearly 45 people have been figuring out how to host the show remotely. The solution involves sending contestants lighting equipment, wardrobe, and the latest iPhone —presumably an iPhone 11 Pro Max. The contestants will be required to film themselves.
The American Idol band has been recording tracks remotely to provide to the Idols. Producers have checked on contestants’ Internet, and each contestant has scouted out a remote filming location.
“These are kids who are really used to iPhone technology, they are really familiar with it and use it every day. In the end, we decided rather than send them some complicated camera that you really need a camera operator to use, we would go with the the technology that they’re familiar with,” Kinane told Deadline.
“These top of the range iPhones are amazing. It wouldn’t surprise me if we were using iPhones in the studio in the future,” she added.
ABC’s Senior Vice President said that ABC was now working with Apple to continue the show.
“We are blessed to live in a day and age where we have technology, even if this had happened five years ago, I don’t know if it would be possible,” he said. “There is a real can-do spirit here that is exciting and exhausting, it’s been fun to figure it out.”
The judges, which includes Katy Perry, Luke Bryan, and Lionel Richie, will also be filming remotely. Ryan Seacrest, the show’s host, will act as an anchor point for the show.
Seacrest had been given an “American Idol” desk as a present after the show had come to an end on Fox and will be using it to host the show from his home.
“We need a home base to come back to. You don’t want it to be chaotic. Ryan is home base, everything goes through him for the live shows,” Kinane said. “Ryan is going to behind an American Idol desk to host the show. It’s been packed up for three and a half years but now its moment has come.”
As countries and companies focus on technologies such as tracking, tracing and testing to fight the pandemic, it’s critical that we also protect people’s privacy. Today, we’re offering seven principles as ideas to consider as we move into the next phases of helping to fight this pandemic.
Governments, public health authorities and industries spanning the globe are engaged in the hard and important work of identifying a path forward to get society back together again. Tracking individuals who are infected, tracing those with whom they have recently come into physical contact and making testing available to those contacts may play an important role in managing the next phase of COVID-19 around the world. As in all other aspects of modern life, digital technologies are likely to be used for tracking, tracing and testing. This requires special care, as sensitive data about our location and health status may be involved.
Preserving privacy as we develop and implement these technical solutions will be critical. Here are seven privacy principles that we offer for governments, public health authorities, academics, employers and industries to consider as we collectively move forward into this next phase of tracking, tracing and testing, and using similar technologies developed to address the COVID-19 pandemic.
Obtain meaningful consent by being transparent about the reason for collecting data, what data is collected and how long it is kept. Data should only be collected with consent and used in the manner explained when people are making the decision to participate. Clear and user-friendly information serves to help promote voluntary participation and can ensure everyone interacting with the technology is making informed choices to participate in data collection and is aware of the purpose of the data collection, the type of data that will be collected, the time period the data will be held and the benefits of the data collection.
Collect data only for public health purposes. The data collected from an individual for purposes of tracing those who have been in physical contact with an infected person and other public health purposes is owned by the individual and should remain under that person’s control. As a general matter, this data should be used by public health authorities only for the articulated public health purposes, and not for unrelated reasons. Public health authorities should provide input regarding the types of data that will be most useful for fighting the pandemic.
Collect the minimal amount of data. Data that is collected by public health authorities for public health purposes, such as tracing, should be limited to only the specific data required, and should only be collected and used for the time period identified as necessary by public health experts.
Provide choices to individuals about where their data is stored. The data must be wholly in the individual’s control, including allowing the individual to choose where to store this data, such as on a device or in the cloud.
Provide appropriate safeguards to secure the data. Reliable security safeguards such as de-identification, encryption, rotating and random identifiers, decentralized identities or similar measures should be in place to protect people’s data from harmful exposure and hacking attempts.
Do not share data or health status without consent, and minimize the data shared. An individual’s data or health status shouldn’t be shared with the individual’s contacts or others without securing the individual’s meaningful consent. If such sharing is pursuant to legal requirements, then the sharing should be strictly limited by the scope of the law. When notifying individuals that they may have been in physical contact with an infected person, only share the minimum amount of data necessary to protect against inferences about the identity of the infected person.
Delete data as soon as it is no longer needed for the emergency. Individuals own their own data, whether stored on a device, a server or in the cloud. Copies of the data that were transferred to public health authorities and others for tracing and other public health purposes should be deleted when no longer useful for public health purposes, as defined by public health authorities. None of the individual’s information should be retained by the authorities or others for future unrelated uses or purposes.
These principles are designed to apply to any COVID-19 technological solutions that involve the collection and use of personal data such as health data, precise geolocation data, proximity or adjacency data, and identifiable contacts.
Our approach is grounded in the belief that, for technology to succeed, people need to be in control of their data, and be empowered with information that explains how their data will be collected and used. Furthermore, companies need to be accountable and responsible for this data. Policymakers, advocacy groups and regulators are starting to share their ideas about guidelines to preserve privacy in any deployment of tracking, tracing and testing technology. We don’t have all the answers, and we look for others to contribute additional ideas, but we hope our principles help advance the discussion.
We need to fight COVID-19 and protect privacy
Addressing global problems of this magnitude understandably creates an urgent need for innovative uses of data to fight the pandemic, and we believe these measures must take privacy into account. The good news is that, today, we have more tools and methods than ever – such as differential privacy, federated learning, decentralized identities, privacy-preserving contract tracing protocols and open source repositories, and other techniques for managing data privacy – to allow society to use data for good and be confident that personal information is kept private.
In the U.S., the need for this conversation in the midst of a pandemic underscores the urgency for a strong federal privacy law. An updated legal framework placing obligations on businesses that collect and use personal data would help provide the necessary guardrails for companies to know how to protect and respect personal data as they create tools and technologies to address urgent societal needs.
Considering the bigger picture
In the context of rising excitement about the possibility of leveraging computing technologies to help with mitigating the pandemic, we note that the issues with, and opportunities for, helping with COVID-19 are complex. Technical advances, such as the use of mobile phones to collect data of various kinds, need to be considered in the larger context of the complexity of the world, such as how comfortable people will be sharing data, the availability of testing resources, the efficacy of the methods under realistic situations of usage, and evolving local and national policies. Concerns over any technology or program include inclusion and the potential for systematic discrimination based on numerous factors. For example, different populations may face different challenges when attempting to participate in health-centric programs based on access to, and familiarity with, technology, depending on race, age, education and income levels. These are also vital issues to address as we move forward.
Privacy and ethical concerns must be considered as we move forward to use data responsibly to defeat the COVID-19 pandemic. Microsoft is committed to serving as a constructive partner in this fight.
Here’s How Super Mario Odyssey Might Have Looked If It Launched On Nintendo 64
Super Mario Odyssey is one of the Switch’s finest looking games (and finest games full stop, we might add), but strip away all of its shiny HD polish and you can end up with a version that looks like it would have been right at home on the Nintendo 64.
Modder Kaze Emanuar, known for tinkering around with that console’s classic 3D Mario, Super Mario 64, is back once again. This time, he’s released a new mod which is essentially a Mario 64-style demake of Super Mario Odyssey, complete with 80 Moons to collect across a number of worlds.
As you can see in the homemade trailer above, plenty of locations from Odyssey have been remade within Mario 64’s iconic style, and you can even use Cappy to capture enemies just like the real thing. He’s actually posted a playthrough of his creation to YouTube, too, which you can view for yourself below if you’re interested.
Cyberpunk 2077 Xbox Is Final Limited Edition Xbox One X
Microsoft's planned reveal of a special Cyberpunk 2077 limited edition Xbox One X was spilled a little early, thanks to errant Amazon listings and a trailer leak. The official word has now gone out, but it revealed one new detail: this will be the final limited edition Xbox One X console.
"Be sure to keep an eye out for future details as this will be the final Xbox One X limited edition console to ever be released, and only 45,000 units will be available in select markets," reads the announcement on the Major Nelson blog.
Cyberpunk is among the biggest games planned for this year, and as Microsoft prepares to launch Xbox Series X it will probably be looking to the new generation for its special editions. It makes sense that this one will be the swan song, and it looks like the designers went out on a high note.
Streets Of Rage 4 Appears To Be Getting A Day-One Update
As you might have heard, Dotemu, Lizardcube, and Guard Crush have finally locked in the launch date for Streets of Rage 4. It’s arriving on the Switch and multiple other platforms on 30th April and will retail for £22.49 / $24.99.
Alongside this announcement was the first look at the game’s Battle Mode – which we noted was a legacy experience returning from Streets of Rage 2 and 3. What’s also been uncovered for the title now is a day-one update.
While the size of the game has already been confirmed as 3.1 GB, according to information from the official PlayStation servers, you’ll need to clear up an extra 1 GB of free space for some combo system improvements, bug fixes, and “global polish” of music and sound design.
Will you be taking to the streets when the fourth entry arrives on 30th April? Comment down below.
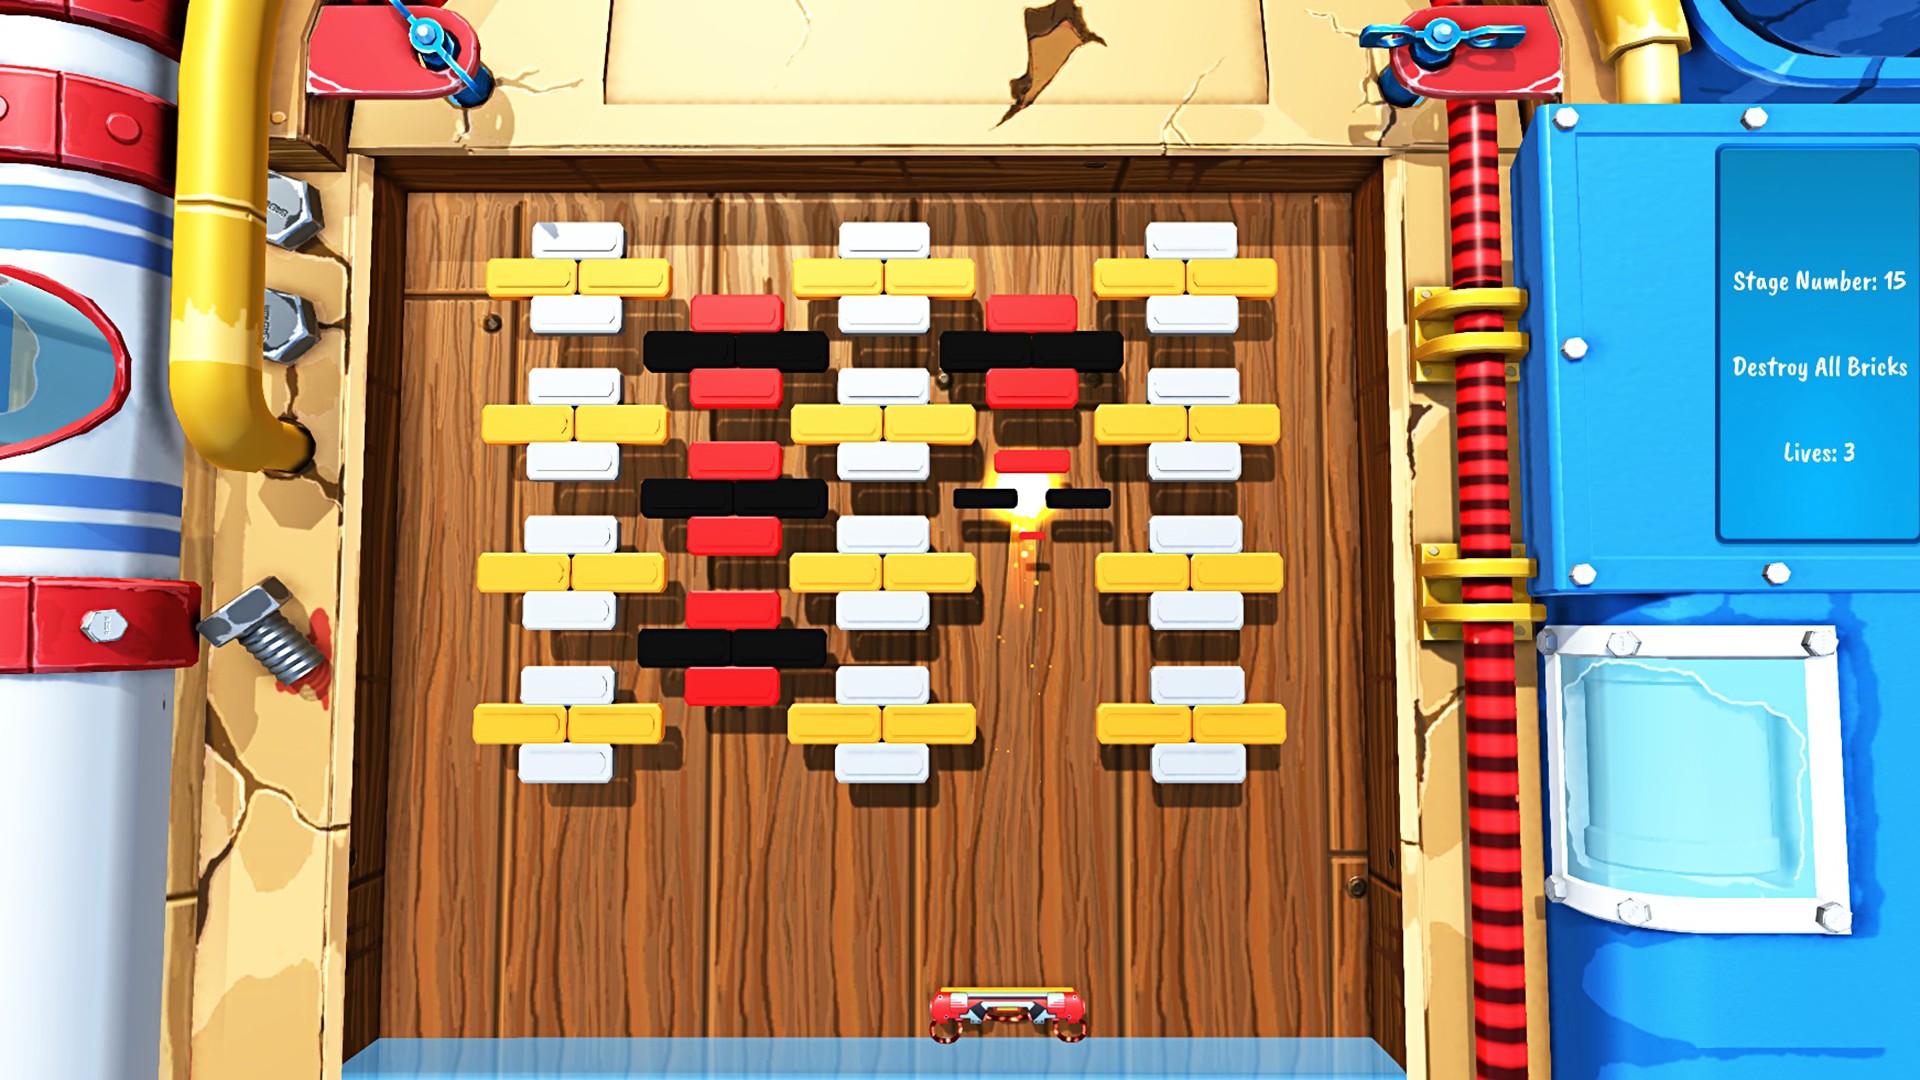
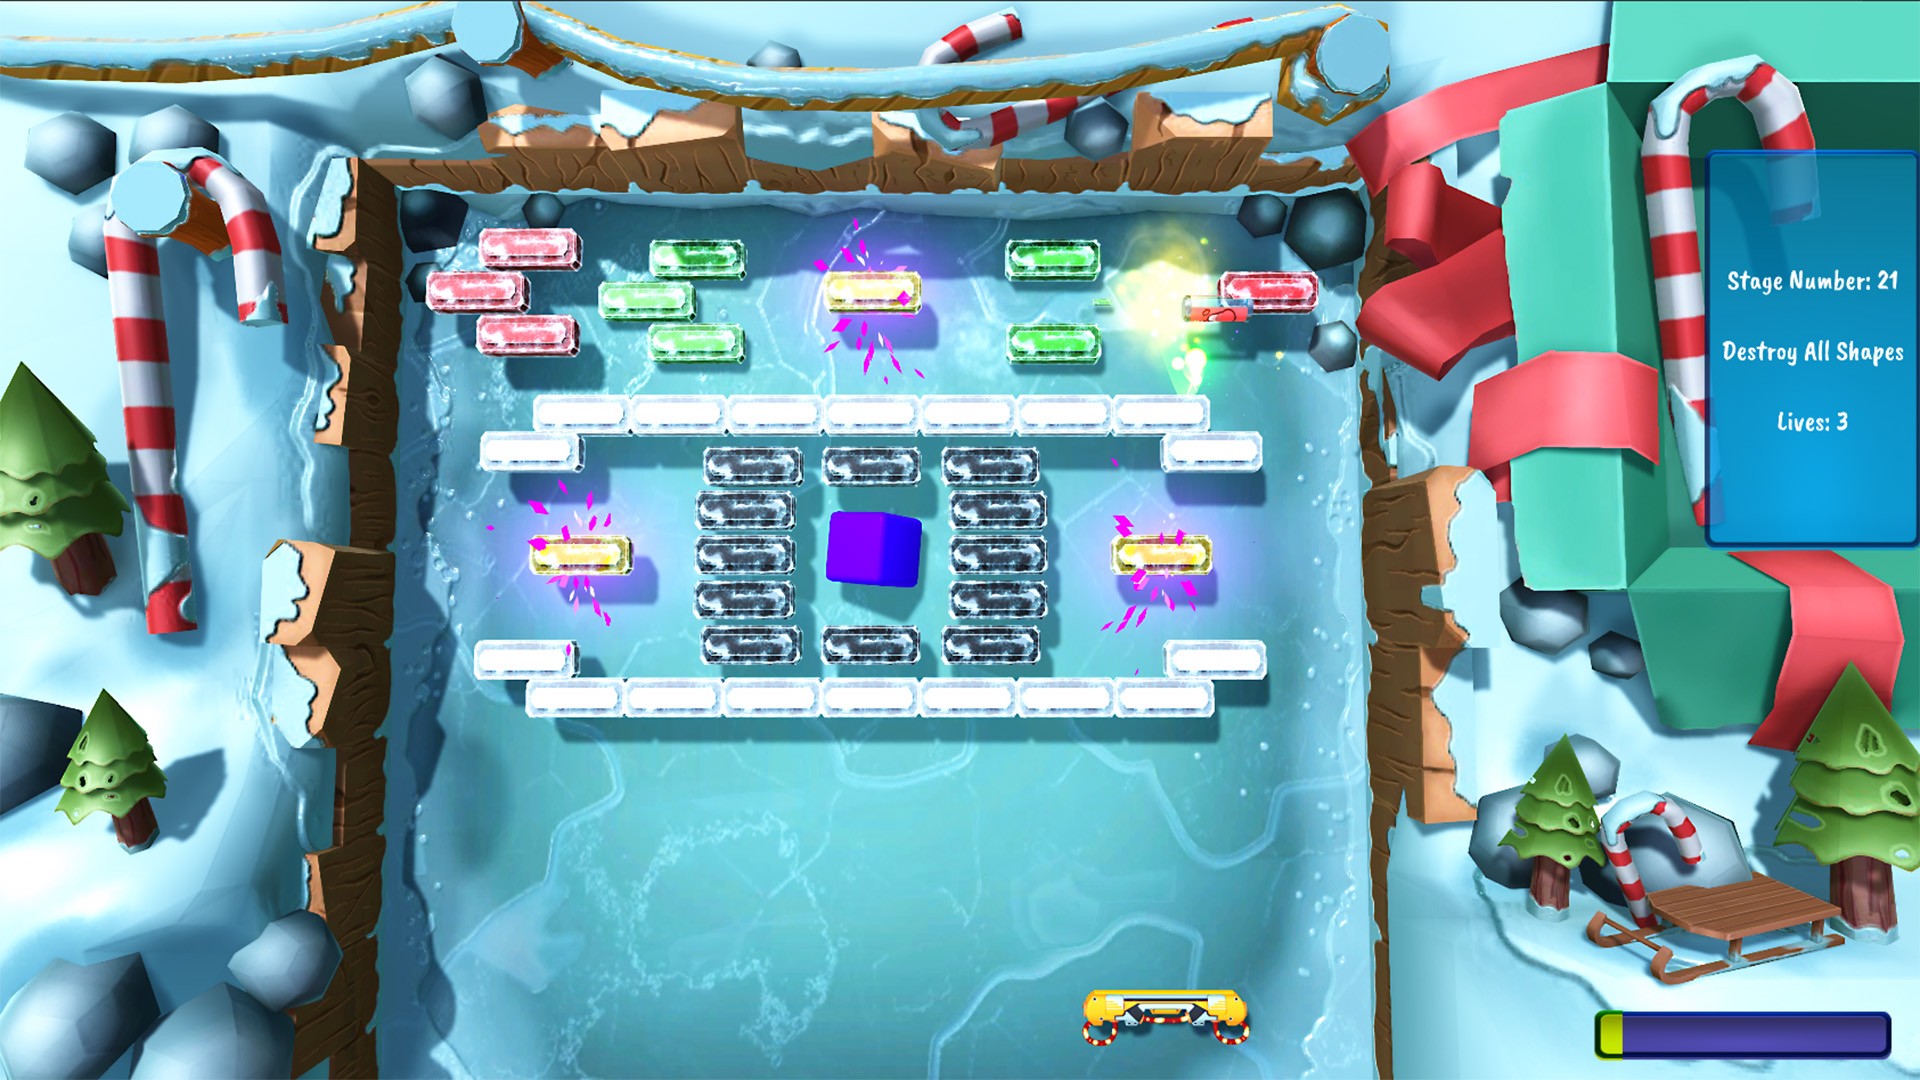
Game industry changes, popular and trending games differ by era. The arcade games we knew in the 80s and 90s are a minority now. We wanted to rekindle that old-school flame once again with Glaive: Brick Breaker.
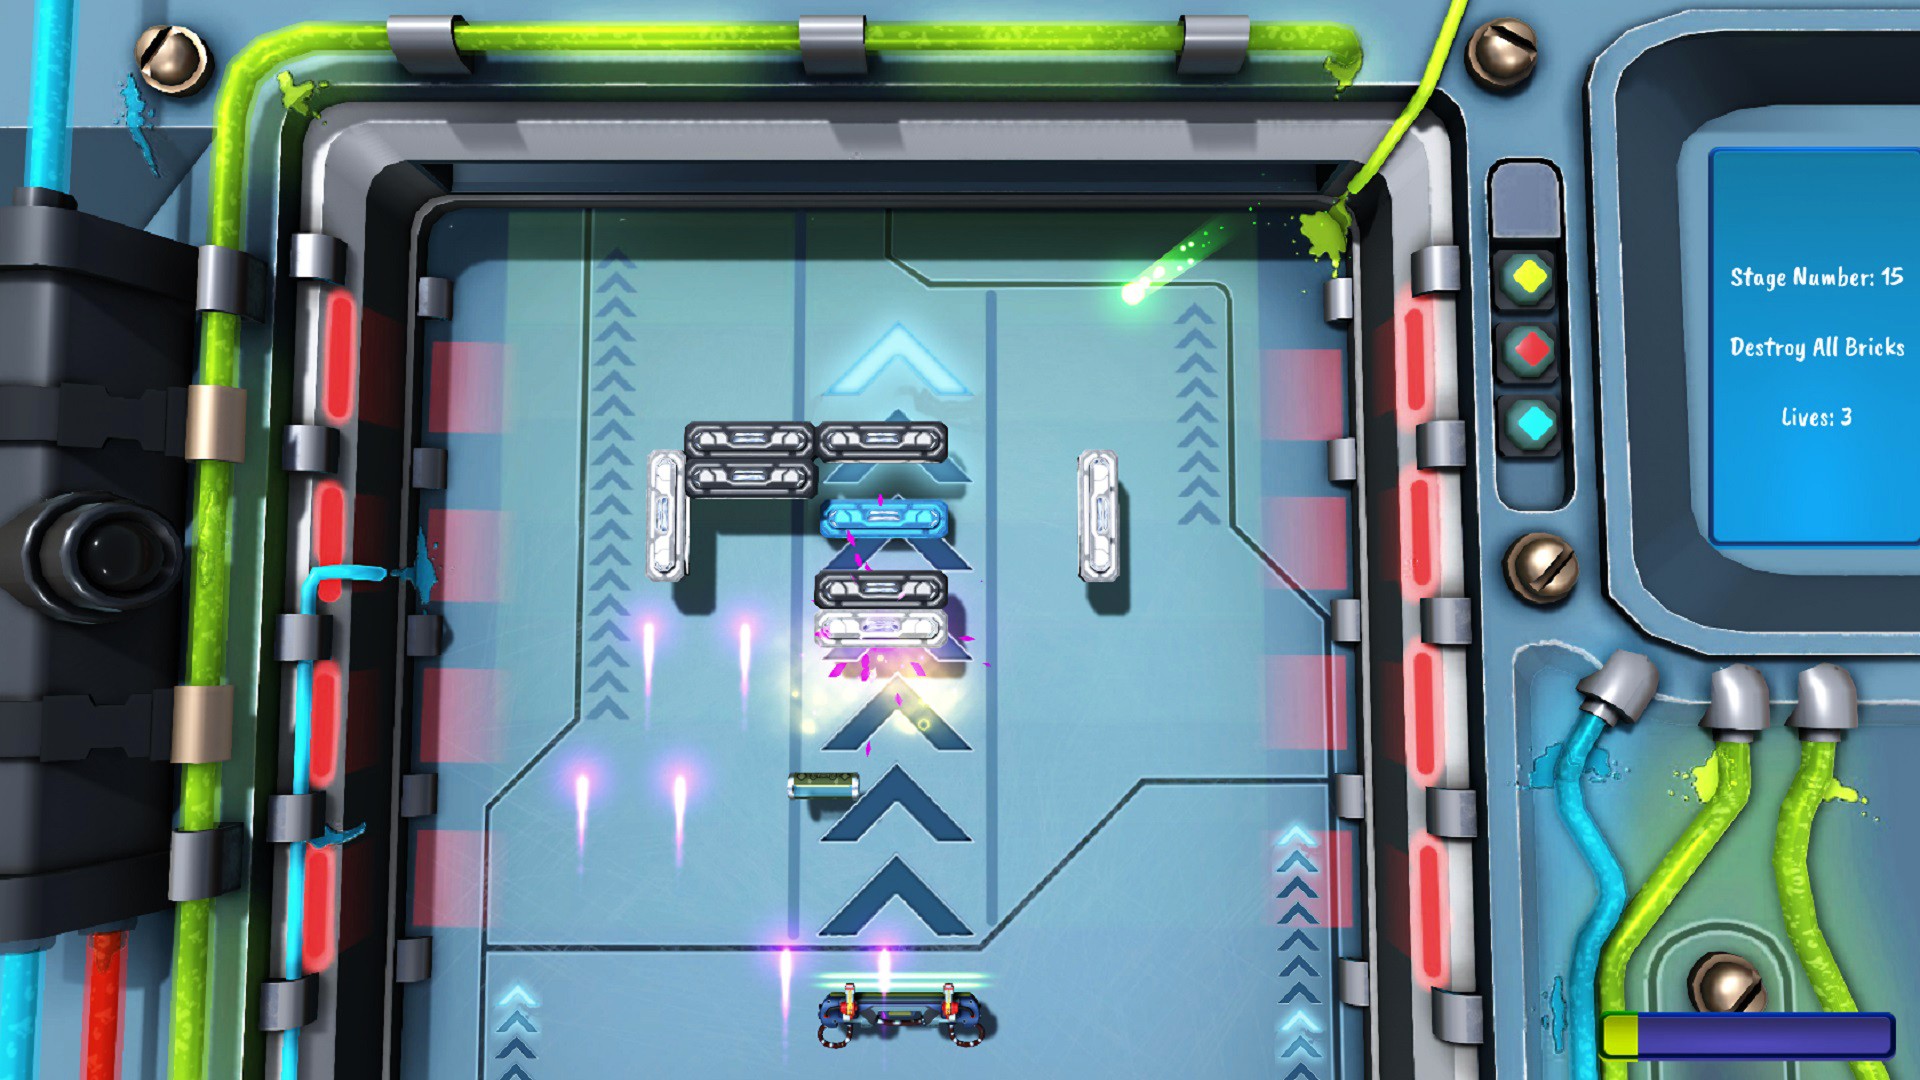
Keeping that thought in our minds, we wanted to make a game that would bring those old memories back. With upgraded game systems, new ideas for game mechanics, better visuals, level creator and local versus mode we wanted to present brick breaker genre from a new perspective. You will find many different power-ups in game like magnetic fields, blasters, rockets, fireballs and even special abilities usable in each stage.
Players will find over 200 levels of pure arcade fun, great for short game session between bigger titles. That’s also something we do, while creating games – quick few rounds of Glaive: Brick Breaker during coffee breaks ideally put out any work tension we had.
It’s always great to create something you had in your mind – we incorporated Level Creator mode in Glaive: Brick Breaker, so players can create their own levels and play them. Among different stage themes we have brick types, with different behaviors, possibility to set brick’s durability, color, model and more.
We hope you’ll enjoy breaking down bricks in many levels of Glaive: Brick Breaker as much as we have enjoyed making the game in the first place. We hope so especially now, since our title was made available on Xbox One and we are very happy about this.
Glaive: Brick Breaker
Blue Sunset Games
☆☆☆☆☆2
★★★★★
You have been granted access to pilot “Glaive” – a brick breaking battle ship. Use it to fight through tons of stages of intense arkanoid-style action. Key features: An all-new brick-breaking game. Level Creator Use your Glaive ship to break bricks and obtain many different powerups. Over 200 levels. Easy to learn controls. Great ball mechanics, that let you control it’s speed with a bit of experience. 2 player versus mode – grab a friend and find out who’s better. Boss fights – it’s never easy, but you can do it! Different game modes – classic, pong, shape breaker, boss fight. Beautiful 3D graphics. ROCKETS! Play on classic wooden table, in icy winter or in futuristic neon set. An all new arkanoid experience is waiting!