Posted by: xSicKxBot - 04-04-2020, 01:22 AM - Forum: Lounge
- No Replies
With Half-Life: Alyx out, Valve shifts focus to its Hammer level editor
Valve released its feature-length VR game Half-Life: Alyx to the world last week, and now the team behind the game is shifting its focus to instead work on getting its accompanying Hammer level editor out to the world.
Hammer, which might end up being non-Valve devs’ only taste of Source 2 development tools, was originally planned to release alongside Half-Life: Alyx in March, but mention of it was noticeably absent on launch day.
While Valve has yet to share a new release date for the level editing tool, the folks at Rock Paper Shotgun did manage to spot a comment from Valve’s Jake Rodkin on ResetEra saying that Hammer is the next priority for the game now that Alyx has made it out into the world.
“It’s the team’s focus now that the game’s out,” wrote Rodkin, though the text of his comment has since been replaced with a solitary period. “There will be more info soon but we’re working on it.”
Posted by: xSicKxBot - 04-04-2020, 01:21 AM - Forum: Lounge
- No Replies
Twitch Has Record-Setting Quarter Amid Coronavirus Lockdown
With people around the globe stuck in their homes in recent weeks, they've evidently been watching a lot of Twitch streamers. The service had its best quarter ever, breaking a record with more than 3 billion hours watched.
According to streaming tools service StreamLabs, Twitch hit new highs for both hours viewed and hours streamed, with about three times what YouTube Gaming Live managed during the same period.
Twitch saw its watch hours increase by 23 percent between February and March, with concurrent viewership rising by nearly 20 percent. While this was a period when people began self-quarantining because of coronavirus (COVID-19), it also saw the release of major games like Doom Eternal, Nioh 2, and Animal Crossing: New Horizons. Twitch streaming hours had actually been on the decline last year.
Are you tired with the same old 2D plots? Do you want to take your plots to the next level? Well look no further, it’s time to learn how to make 3D plots in matplotlib.
In addition to import matplotlib.pyplot as plt and calling plt.show(), to create a 3D plot in matplotlib, you need to:
Import the Axes3D object
Initialize your Figure and Axes3D objects
Get some 3D data
Plot it using Axes notation and standard function calls
# Standard import

import matplotlib.pyplot as plt # Import 3D Axes from mpl_toolkits.mplot3d import axes3d # Set up Figure and 3D Axes fig = plt.figure()

ax = fig.add_subplot(111, projection='3d') # Get some 3D data

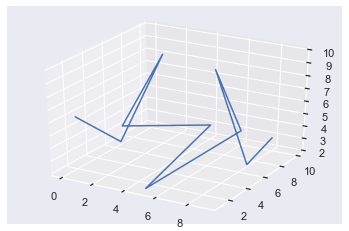
X = [0, 1, 2, 3, 4, 5, 6, 7, 8, 9]

Y = [2, 5, 8, 2, 10, 1, 10, 5, 7, 8]

Z = [6, 3, 9, 6, 3, 2, 3, 10, 2, 4] # Plot using Axes notation and standard function calls

ax.plot(X, Y, Z)

plt.show()
Awesome! You’ve just created your first 3D plot! Don’t worry if that was a bit fast, let’s dive into a more detailed example.
Try it yourself with our interactive Python shell. Just execute the code and look at the generated “plot.png” file:
If you are used to plotting with Figure and Axes notation, making 3D plots in matplotlib is almost identical to creating 2D ones. If you are not comfortable with Figure and Axes plotting notation, check out this article to help you.
Besides the standard import matplotlib.pyplot as plt, you must alsofrom mpl_toolkits.mplot3d import axes3d. This imports a 3D Axes object on which a) you can plot 3D data and b) you will make all your plot calls with respect to.
You set up your Figure in the standard way
fig = plt.figure()
And add a subplots to that figure using the standard fig.add_subplot() method. If you just want a single Axes, pass 111 to indicate it’s 1 row, 1 column and you are selecting the 1st one. Then you need to pass projection='3d' which tells matplotlib it is a 3D plot.
From now on everything is (almost) the same as 2D plotting. All the functions you know and love such as ax.plot() and ax.scatter() accept the same keyword arguments but they now also accept three positional arguments – X,Y and Z.
In some ways 3D plots are more natural for us to work with since we live in a 3D world. On the other hand, they are more complicated since we are so used to 2D plots. One amazing feature of Jupyter Notebooks is the magic command %matplotlib notebook which, if ran at the top of your notebook, draws all your plots in an interactive window. You can change the orientation by clicking and dragging (right click and drag to zoom in) which can really help to understand your data.
As this is a static blog post, all of my plots will be static but I encourage you to play around in your own Jupyter or IPython environment.
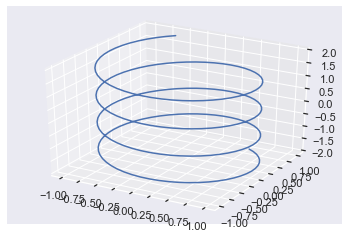
Here’s an example of the power of 3D line plots utilizing all the info above.
# Standard imports

import matplotlib.pyplot as plt

import numpy as np # Import 3D Axes from mpl_toolkits.mplot3d import axes3d # Set up Figure and 3D Axes fig = plt.figure()

ax = fig.add_subplot(111, projection='3d') # Create space of numbers for cos and sin to be applied to

theta = np.linspace(-12, 12, 200)

x = np.sin(theta)

y = np.cos(theta) # Create z space the same size as theta z = np.linspace(-2, 2, 200) ax.plot(x, y, z)

plt.show()
To avoid repetition, I won’t explain the points I have already made above about imports and setting up the Figure and Axes objects.
I created the variable theta using np.linspace which returns an array of 200 numbers between -12 and 12 that are equally spaced out i.e. there is a linear distance between them all. I passed this to np.sin() and np.cos() and saved them in variables x and y.
If you just plotted x and y now, you would get a circle. To get some up/down movement, you need to modify the z-axis. So, I used np.linspace again to create a list of 200 numbers equally spaced out between -2 and 2 which can be seen by looking at the z-axis (the vertical one).
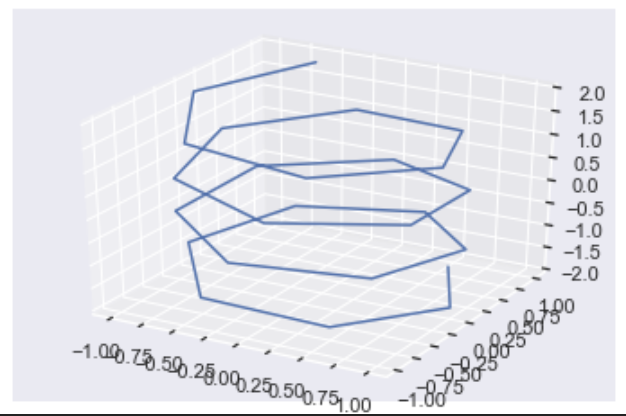
Note: if you choose a smaller number of values for np.linspace the plot is not as smooth.
For this plot, I set the third argument of np.linspace to 25 instead of 200. Clearly, this plot is much less smooth than the original and hopefully gives you an understanding of what is happening under the hood with these plots. 3D plots can seem daunting at first so my best advice is to go through the code line by line.
Matplotlib 3D Plot Scatter
Creating a scatter plot is exactly the same as making a line plot but you call ax.scatter instead.
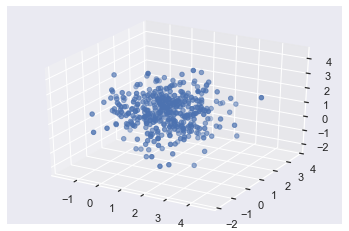
Here’s a cool plot that I adapted from this video. If you sample a normal distribution and create a 3D plot from it, you get a ball of points with the majority focused around the center and less and less the further from the center you go.
import random

random.seed(1) # Create 3 samples from normal distribution with mean and standard deviation of 1

x = [random.normalvariate(1, 1) for _ in range(400)]

y = [random.normalvariate(1, 1) for _ in range(400)]

z = [random.normalvariate(1, 1) for _ in range(400)] # Set up Figure and Axes

fig = plt.figure()

ax = fig.add_subplot(111, projection='3d') # Plot

ax.scatter(x, y, z)

plt.show()
First, I imported the python random module and set the seed so that you can reproduce my results. Next, I used three list comprehensions to create 3 x 400 samples of a normal distribution using the random.normalvariate() function. Then I set up the Figure and Axes as normal and made my plot by calling ax.scatter().
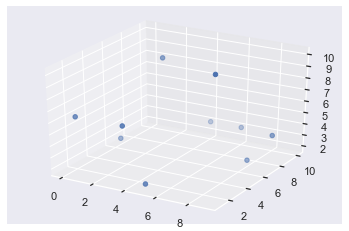
In this example, I plotted the same X, Y and Z lists as in the very first example. I want to highlight to you that some of the points are darker and some are more transparent – this indicates depth. The ones that are darker in color are in the foreground and those further back are more see-through.
If you plot this in IPython or an interactive Jupyter Notebook window and you rotate the plot, you will see that the transparency of each point changes as you rotate.
Matplotlib 3D Plot Rotate
The easiest way to rotate 3D plots is to have them appear in an interactive window by using the Jupyter magic command %matplotlib notebook or using IPython (which always displays plots in interactive windows). This lets you manually rotate them by clicking and dragging. If you right-click and move the mouse, you will zoom in and out of the plot. To save a static version of the plot, click the save icon.
It is possible to rotate plots and even create animations via code but that is out of the scope of this article.
Matplotlib 3D Plot Axis Labels
Setting axis labels for 3D plots is identical for 2D plots except now there is a third axis – the z-axis – you can label.
You have 2 options:
Use the ax.set_xlabel(), ax.set_ylabel() and ax.set_zlabel() methods, or
Use the ax.set() method and pass it the keyword arguments xlabel, ylabel and zlabel.
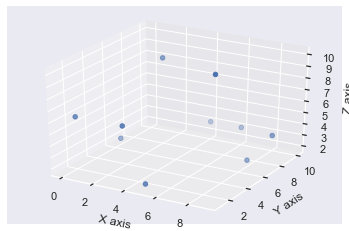
You may notice that the axis labels are not particularly visible using the default settings. You can solve this by manually increasing the size of the Figure with the figsize argument in your plt.figure() call.
One thing I don’t like about method 1 is that it takes up 3 lines of code and they are boring to type. So, I much prefer method 2.
# Set Figure to be 8 inches wide and 6 inches tall

fig = plt.figure(figsize=(8, 6))

ax = fig.add_subplot(111, projection='3d')

ax.scatter(X, Y, Z) # Method 2 - set all labels in one line of code!

ax.set(xlabel='X axis', ylabel='Y axis', zlabel='Z axis') plt.show()
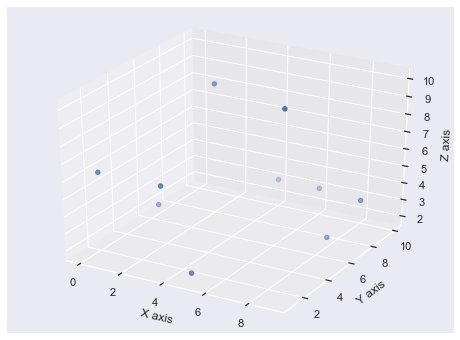
Much better! Firstly, because you increased the size of the Figure, all the axis labels are clearly visible. Plus, it only took you one line of code to label them all. In general, if you ever use a ax.set_<something>() method in matplotlib, it can be written as ax.set(<something>=) instead. This saves you space and is nicer to type, especially if you want to make numerous modifications to the graph such as also adding a title.
Matplotlib 3D Plot Legend
You add legends to 3D plots in the exact same way you add legends to any other plots. Use the label keyword argument and then call ax.legend() at the end.
import random random.seed(1)

fig = plt.figure()

ax = fig.add_subplot(111, projection='3d') # Plot and label original data

ax.scatter(X, Y, Z, label='First Plot') # Randomly re-order the data

for data in [X, Y, Z]: random.shuffle(data) # Plot and label re-ordered data

ax.scatter(X, Y, Z, label='Second Plot') ax.legend(loc='upper left')

plt.show()
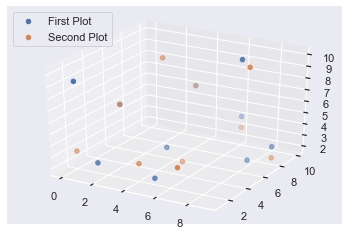
In this example, I first set the random seed to 1 so that you can reproduce the same results as me. I set up the Figure and Axes as expected, made my first 3D plot using X, Y and Z and labeled it with the label keyword argument and an appropriate string.
To save me from manually creating a brand new dataset, I thought it would be a good idea to make use of the data I already had. So, I applied the random.shuffle() function to each of X, Y and Z which mixes the values of the lists in place. So, calling ax.plot() the second time, plotted the same numbers but in a different order, thus producing a different looking plot. Finally, I labeled the second plot and called ax.legend(loc='upper left') to display a legend in the upper left corner of the plot.
All the usual things you can do with legends are still possible for 3D plots. If you want to learn more than these basic steps, check out my comprehensive guide to legends in matplotlib.
Note: If you run the above code again, you will get a different looking plot. This is because you will start with the shuffled X, Y and Z lists rather than the originals you created further up inb the post.
Matplotlib 3D Plot Background Color
There are two backgrounds you can modify in matplotlib – the Figure and the Axes background. Both can be set using either the .set_facecolor('color') or the .set(facecolor='color') methods. Hopefully, you know by now that I much prefer the second method over the first!
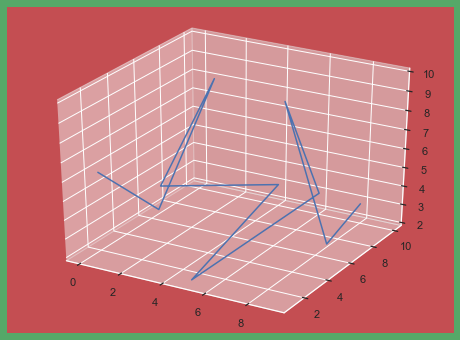
Here’s an example where I set the Figure background color to green and the Axes background color to red.
fig = plt.figure(figsize=(8, 6))

ax = fig.add_subplot(111, projection='3d')

ax.plot(X, Y, Z) # Axes color is red

ax.set(facecolor='r')

# Figure color is green

fig.set(facecolor='g')

plt.show()
The first three lines are the same as a simple line plot. Then I called ax.set(facecolor='r') to set the Axes color to red and fig.set(facecolor='g') to set the Figure color to green.
In an example with one Axes, it looks a bit odd to set the Figure and Axes colors separately. If you have more than one Axes object, it looks much better.
# Set up Figure and Axes in one function call

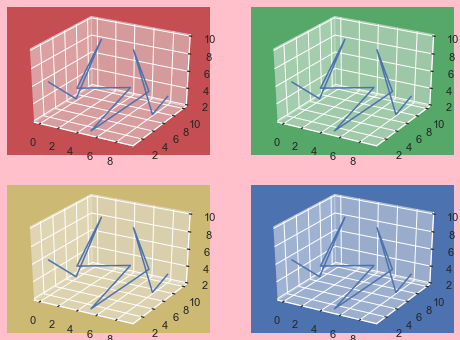
fig, axes = plt.subplots(nrows=2, ncols=2, figsize=(8, 6), subplot_kw=dict(projection='3d')) colors = ['r', 'g', 'y', 'b'] # iterate over colors and all Axes objects

for c, ax in zip(colors, axes.flat): ax.plot(X, Y, Z) # Set Axes color ax.set(facecolor=c) # Set Figure color

fig.set(facecolor='pink')

plt.show()
In this example, I used plt.subplots() to set up an 8×6 inch Figure containing four 3D Axes objects in a 2×2 grid. The subplot_kw argument accepts a dictionary of values and these are passed to add_subplot to make each Axes object. For more info on using plt.subplots() check out my article.
Then I created the list colors containing 4 matplotlib color strings. After that, I used a for loop to iterate over colors and axes.flat. In order to iterate over colors and axes together, they need to be the same shape. There are several ways to do this but using the .flat attribute works well in this case.
Finally, I made the same plot on each Axes and set the facecolors. It is clear now why setting a Figure color can be more useful if you create subplots – there is more space for the color to shine through.
Conclusion
That’s it, you now know the basics of creating 3D plots in matplotlib!
You’ve learned the necessary imports you need and also how to set up your Figure and Axes objects to be 3D. You’ve looked at examples of line and scatter plots. Plus, you can modify these by rotating them, adding axis labels, adding legends and changing the background color.
There is still more to be learned about 3D plots such as surface plots, wireframe plots, animating them and changing the aspect ratio but I’ll leave those for another article.
Where To Go From Here?
Do you wish you could be a programmer full-time but don’t know how to start?
Check out the pure value-packed webinar where Chris – creator of Finxter.com – teaches you to become a Python freelancer in 60 days or your money back!
It doesn’t matter if you’re a Python novice or Python pro. If you are not making six figures/year with Python right now, you will learn something from this webinar.
These are proven, no-BS methods that get you results fast.
This webinar won’t be online forever. Click the link below before the seats fill up and learn how to become a Python freelancer, guaranteed.
The 168th GalaQuiz will be LIVE soon, win up to $50 in GalaCredit!
[www.indiegala.com] The GalaQuiz will take place in less than 10 minutes from this announcement Today's GalaQuiz[www.indiegala.com] hints are up. The theme will be Animals Redux #3.
Posted by: xSicKxBot - 04-03-2020, 04:46 PM - Forum: Windows
- No Replies
Autonomous systems 101: Q&A about building intelligent control systems
The AI for Business and Technology blog is always looking for ways to help our readers understand how their businesses can benefit from the latest in artificial intelligence and technology. Today, we are talking with Microsoft Senior Applied AI Engineer Kingsuk Maitra. Kingsuk has a PhD in electrical engineering and now leads customer success engagements for autonomous systems at Microsoft.
Blog: Let’s start by figuring out what it is we’re talking about. What exactly is an autonomous system?
Kingsuk: Well, the basic idea of automation is to do repetitive tasks without human involvement, using an established pattern that is somewhat predictable. An autonomous system, on the other hand, is way more than automation because the system is also making informed and intuitive decisions with a substantive amount of knowledge and know-how.
If you expose an autonomous system to uncharted territory, it can make a recommendation to inform decision making, whereas strict automation wouldn’t be able to do anything without explicit human intervention. This essentially frees up human resources and ingenuity for making much more informed decisions. And it also gives you a lot more leverage and liberty and latitude when it comes to ensuring quality and preventing human errors.
Blog: How does an autonomous system learn to make these recommendations?
Kingsuk: Well, artificial intelligence at a very basic level allows a machine to learn from existing experience and existing data. Traditional machine learning is predicated on the availability of large quantities of data. But in the real-life scenarios where autonomous systems are critical to day-to-day operations, such as industrial control systems the environment is often uncertain, and data is sparse. It’s noisy, unstructured and messy, and there’s no easy way to collect a lot of data and methodically label it. So what you can do is model the environment where an autonomous system is supposed to make an impact, and then let the autonomous system explore that simulated environment while being supervised by an operator.
That’s the Microsoft approach, which incorporates machine teaching and reinforcement learning. Years of expertise and experience from a seasoned human operator in a particular vertical can be incorporated into the knowledge base through machine teaching, and that is layered on top of the inputs and signals from the low-fidelity simulator. The autonomous system learns by testing out various actions and being rewarded as it takes the correct action, which is reinforcement learning.
Intelligent control systems can help machinery and processes adapt to dynamic environments in real time.
Blog: What kinds of industries could use autonomous systems?
Kingsuk: This type of solution is scalable across multiple verticals, be it manufacturing, industrial automation, energy and many others. These verticals all have their own specialized simulators, and each of them has hundreds of years of research and billions of dollars in development that has gone into the discipline to make them very mature disciplines. So Microsoft’s point of view is that we are not offering a black box solution that is going to go in and disrupt everything they have known for all that time. What we are saying is we use AI to augment the human learning that already exists in those spaces, offering this one solution that can scale. We are not replacing anything, just adding to it.
And not only is this a way to find new solutions to existing problems, but it also offers the opportunity to solve problems that were previously thought unsolvable.
Blog: What’s one example of autonomous systems being applied?
One great example of this is new product introduction, or NPI, which is a complex problem. Most of the time, a new product has a long wish list of properties it needs to have, and the way it often works is a kind of educated guesswork. There might be 50 to 200 parameters, and a person uses heuristics and trial and error, working each parameter sequentially, and it takes several months in a best-case scenario.
With machine teaching and autonomous systems, you can optimize all those parameters, work simultaneously and in parallel and the whole process takes just weeks.
Not only does this save time but it reduces waste, which is better for the environment, and it allows the product to get to market quicker, when it is actually in demand. The market can change so quickly that something that was needed months earlier may no longer be needed.
We at Microsoft are also using this technology internally for power and efficiency optimization of our buildings, which will not only save money but will help us move toward our sustainability and carbon neutrality goals.
Magic The Gathering: Here's Another New Card From Ikoria: Lair of Behemoth
Recently, GameSpot had a big reveal for the upcoming Magic: The Gathering set Ikoria: Lair of Behemoth. We saw Snapdex, Apex of the Hunt, whose Godzilla Series Monster version is none other than King Caesar. Now, we have another reveal for the upcoming set.
Auspicious Starrix is a 6/6 creature from the upcoming set, which will launch in April and May. It utilizes the new Mutate mechanic, which allows you to combine creatures into one, unstoppable beast. Additionally, while using the Mutate mechanic, you exile permanent cards from your library, then put those permanents onto the battlefield. Check out the card below.
From the Ikoria: Lair of Behemoth set
"We wanted to go all out showing how awesome Godzilla in Magic would be, so we made sure to bring the new Mutate ability onto these cards," lead product designer of Ikoria: Lair of Behemoths Mike Turian explained to GameSpot. "Then when you combine Magic and Godzilla, there are so many evergreen abilities that fit perfectly so we mixed in those also. Who doesn’t want to have an amazing Godzilla that tramples over all of your opponent’s puny creatures?"
The Defold game engine is a free cross platform 2D focused game engine from King, we previously covered here and here as well as a video tutorial here. The Defold team recently released an update on the future roadmap of the Defold game engine.
iOS
We will continue to keep the iOS platform support up to date with the latest iOS versions and requirements. Specific iOS tasks in no particular order:
Metal
Apple has announced that OpenGL will be deprecated on iOS and macOS, but no date has been announced. We have worked during 2019 to add a new Vulkan based graphics backend. This work is nearing completion and it will allow us to use MoltenVK on iOS and macOS. MoltenVK is a Vulkan Portability implementation. It layers a subset of the high-performance, industry-standard Vulkan graphics and compute API over Apple’s Metal graphics framework, enabling Vulkan applications to run on iOS and macOS. We have worked together with members of the Khronos Group to benchmark our implementation and have received only a few points of improvement.
Sign in with Apple
Apple will require that apps that authenticate or set up user accounts must support Sign in with Apple (SIWA). The deadline is June 30, 2020. We will release SIWA support through a native extension in Q2 of 2020. The extension has been developed at King and has already been tested in production.
Storyboard launch screens
Apple will require that apps use Xcode storyboards as the app’s launch screen. The deadline is June 30, 2020. We will automatically create a launch screen storyboard from the launch images set in game.project.
Android
We will continue to keep the Android platform support up to date with the latest Android requirements. We are collaborating with the Android and Google Play partnership teams to identify important tasks. The top four tasks in order of priority are:
Billing
Google Play Billing is a service that lets you sell digital content on Android. We will add support for the new Billing API via the existing IAP extension.
Google Play Game Services
We will continue to improve on the existing Google Play Game Services extension to ensure that it supports all of the latest features of Google Play Game Services.
Android App Bundles
Android App Bundle is a publishing format that includes all your app’s compiled code and resources, and defers APK generation and signing to Google Play. Google Play uses your app bundle to generate and serve optimized APKs for each device configuration, so only the code and resources that are needed for a specific device are downloaded to run your app. We will initially add support for basic bundling of applications using Android App Bundles and then expand upon the feature as needed.
Google Play Instant
Google Play Instant enables native games to launch on devices running Android 5.0 (API level 21) or higher without being installed. By allowing users to run an instant game, known as providing an instant experience, you improve your game’s discovery, which helps drive more active users or installations.
HTML5
We will focus on increased performance and reduced application size on HTML5. We will when possible update to newer versions of Emscripten and WebAssembly to achieve this.
Desktop
On desktop our only identified focus area is to add the ability to run the engine loop while the window is in the background.
Editor
We will mainly focus on performance and stability improvements in the editor. In terms of new features we have identified the following (in no particular order):
Improved 3D support
In 2019 we added support for perspective cameras and made some improvements to how collision shapes were visualised. These changes made it easier to work with and place 3D models in a collection, but there are still many improvements to be made to scene navigation when working in a 3D.
Auto-tiling
While we did some minor improvements to the tilemap system in 2019 (better tile palette and interleaved layers) we have so far left out auto-tiling. Auto-tiling can really speed up tilemap editing and it is the next big feature to add for the tilemap editor.
Editor extensions
We plan to expand the existing system for editor scripts to allow for more complex operations and we will look at how to customize the UI and/or add new UI widgets using editor scripts.
GUI layouts and templates
The system with GUI layouts and templates where one or both involve value overrides is fairly complex and hard to work with from a code maintenance perspective. We plan to review the system and possibly simplify it.
Engine
In 2019 we made several changes to improve editor stability. Two examples of this were reduced ANRs on Android and a standardized application loop on iOS. In 2020 we will continue to identify and fix stability issues in the engine. Besides stability improvements we will also work on the following features (in no particular order):
Sound threading
Sound playback is currently done on the main thread together with the rest of the game loop. This can become a problem if loading large resources while playing sound, resulting in playback stutter. The solution is to do sound playback on a separate thread to avoid stutter when loading content.
Physics decoupling
Physics is currently running at the same rate as the rest of the game loop. We will try to decouple the physics simulation from the game loop by running the simulation on a separate thread and optionally with a different number of updates per second.
Spine as an extension
We will look into the possibility of using the official Spine runtime as an extension and a replacement for the existing custom made native Spine support. This will allow the use of newer versions of Spine, something that currently is not possible with the existing and custom Spine runtime.
Physics as an extension
We will look into the possibility of moving the Box2D and Bullet3D physics engines to a native extension. This will allow the community to update or replace the physics simulation with an update version or completely different implementation.
Live update
We’re very happy to see that the live update functionality is used in several different scenarios (from Android Expansion Files to Steam DLCs). We have with the help of the community identified several improvements and we plan to deliver the most critical improvements in 2020.
Mesh component
The custom mesh component will be released in Q2 of 2020.
Vulkan
We will release support for Vulkan on all systems where it is supported. On Android it will be used by default on newer devices. On iOS it will be used under the hood to be able to use MoltenVK (see iOS above).
Build server
The Defold build server for native extensions will be open sourced in Q2 of 2020 to allow developers to build locally or set up their own build servers to cut the dependency to the Defold provided build service.
You can learn more about the Defold Game engine roadmap in the video below. The tutorial mentioned in the video is open source and available here on Github.
That’s it! You should now be all set to use .NET 5 Preview2.
What’s new?
ASP.NET Core in .NET 5 Preview 2 doesn’t include any major new features just yet, but it does include plenty of minor bug fixes. We expect to announce new features in upcoming preview releases.
See the release notes for additional details and known issues.
Give feedback
We hope you enjoy this release of ASP.NET Core in .NET 5! We are eager to hear about your experiences with this latest .NET 5 release. Let us know what you think by filing issues on GitHub.
Apple News outage briefly impacted selected users [u]
By William Gallagher Friday, April 03, 2020, 03:40 am PT (06:40 am ET)
A small number of users worldwide were reporting that Apple News was down for a period of time on Friday morning, but there was no consistency to which territories were affected, and devices on the same network could be working.
These two iPhones are on the same network and using the same Apple ID. The iPad that the shot was taken with also has Apple News running, but it did take longer than usual to load.
Reports overnight claimed that the Apple News service was down, with users worldwide saying that the app wasn’t populated with stories, and then displaying an error message. That message said that the “feed is unavailable,” and recommended trying again later.
However, not only was Apple’s regular service status reporting no problems, Apple News is appearing as normal for most people.
More peculiarly, that included people who have multiple devices —one may have said the feed is unavailable, but the other showed the regular service. In some cases, the feed is taking longer than usual to appear.
In AppleInsider testing, the majority of iOS devices, and Macs, were all working correctly. In one test of four devices on the same network and with the same Apple ID, two worked perfectly, one was slow, and only one failed to load Apple News at all.
Update 7:00 A.M. Eastern time: Apple News appears to have been completely restored.





 in GalaCredit!