


Do you want to take a backup of your database? Are you a beginner at using the phpMyAdmin application?
This article will guide you with straightforward bullet points to achieve this.
The phpMyAdmin provides an “Export” operation to take a backup with a few clicks.
How to export databases and tables using phpMyAdmin?
- Log in to the phpMyAdmin interface.
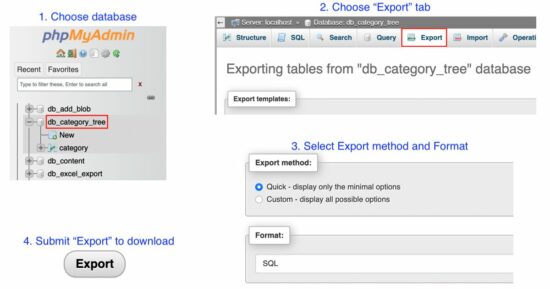
- Choose the database from the left-side menu.
- Click the “Export” tab that exists below the phpMyAdmin header.
- Choose “Export Method” and “Format” of the exported to be in.
- Click “Go” to see or download the exported data.
Note:
Export methods allowed by phpMyAdmin
There are two export methods allowed by the phpMyAdmin interface.
- Quick – Minimal and quick option to export the database and it is the default option.
- Custom – This method allows more customization.
The “Quick” method exports the selected database or table structure and data entirely.
But, the “Custom” method provides more options. Some of them are listed below.
- It allows selecting one are more tables from the list.
- It allows exporting of either structure or data or both.
- It provides the “Save-as” option to mention how to output the exported data. The phpMyAdmin can deliver the exported output in the below ways.
- It will save it as a file if the user selects “Save output to a file”.
- It will show as text on the interface if the user selects “View output as text”.
Export formats provided by phpMyAdmin
It supports numerous formats in which the output exported data. Some of them are listed below.
- SQL (default option)
- CSV
- JSON
- XML
Export a database to another database
To export a database to another database, we have to perform the phpMyAdmin “Import” after the “Export” action.
In a previous tutorial, we have seen how to import a database using phpMyAdmin.
https://www.sickgaming.net/blog/2023/01/...-database/
Share this page