


This article will demonstrate how to use a pandas dataframe method called rolling().
What does the pandas.DataFrame.rolling() method do?
In short, it performs rolling windows calculations.
It is often used when working with time-series data or signal processing. I will shortly dive into a few practical examples to clarify what this means in practice.
The method will be given a parameter that specifies how big the window the desired calculations should be performed in.
A simple example of using time series data could be that each row of a pandas dataframe represents a day with some values.
Let’s say that the desired window size is five days. The rolling method is given a five as input, and it will perform the expected calculation based on steps of five days.
Before an example of this, let’s see the method, its syntax, and its parameters.
pandas.DataFrame.rolling()
Dataframe.rolling(window, min_periods=None, center=False, win_type=None, on=None, axis=0, closed=None, method=’single’)
Let’s dive into the parameters one by one:
window
window: int, offset, or BaseIndexer subclass
This is the size of the moving window.
If an integer, the fixed number of observations is used for each window.
If an offset, the time period of each window. Each window will be variable-sized based on the observations included in the time period. This is only valid for datetime-like indexes.
If a BaseIndexer subclass, the window boundaries are based on the defined get_window_bounds() method. Additional rolling keywords argument, namely min_periods, center, and closed will be passed to get_window_bounds().
min_periods
min_periods: int, default None
This is the minimum number of observations in the window required to have a value.
Otherwise, the result is assigned np.nan.
- For a window that is specified by an offset,
min_periodswill default to 1. - For a window specified by an integer,
min_periodswill default to the size of the window.
center
center: bool, default False
If False, set the window labels as the right edge of the window index. If True, set the window labels as the center of the window index.
win_type
win_type: str, default None
If None, all points are evenly weighted.
If a string, it must be a valid window function from scipy.signal.
Some of the Scipy window types require additional parameters to be passed in the aggregation function.
The additional parameters must match the keywords specified in the Scipy window type method signature.
on
on: str, optional
For a Dataframe, a column label or index level on which to calculate the rolling window, rather than the Dataframes index.
The provided integer column is ignored and excluded from the result since an integer index is not used to calculate the rolling window.
axis
axis: int or str, default 0
If 0 or 'index', roll across the rows. If 1 or 'columns', roll across the columns.
closed
closed: str, default None
- If
'right', the first point in the window is excluded from calculations. - If
'left', the last point in the window is excluded from calculations. - If
'both', then no points in the window are excluded from the calculations. - If
'neither', the first and last points in the window are excluded from the calculations.
Default None means 'right'.
method
method: str {'single', 'table'}, default 'single'
Execute the rolling operation per single column or row for 'single' or over the entire object for 'table'.
This argument is only implemented when specifying engine='numba' in the method call.
This part was obtained from the official pandas documentation.
Data
The data I will be working with for this tutorial is historical data for a stock, the amazon stock.
I use the python package yfinance to import the data. I will use data starting from 2021-04-01 and running one year forward in time.
The data only includes trading days, i.e., days when the stock market was open.
# Get the stock data from Yahoo finance

AmazonData1y = yfinance.Ticker("AMZN").history(period='1y', actions=False, end='2022-04-01')

display(AmazonData1y.head(20))

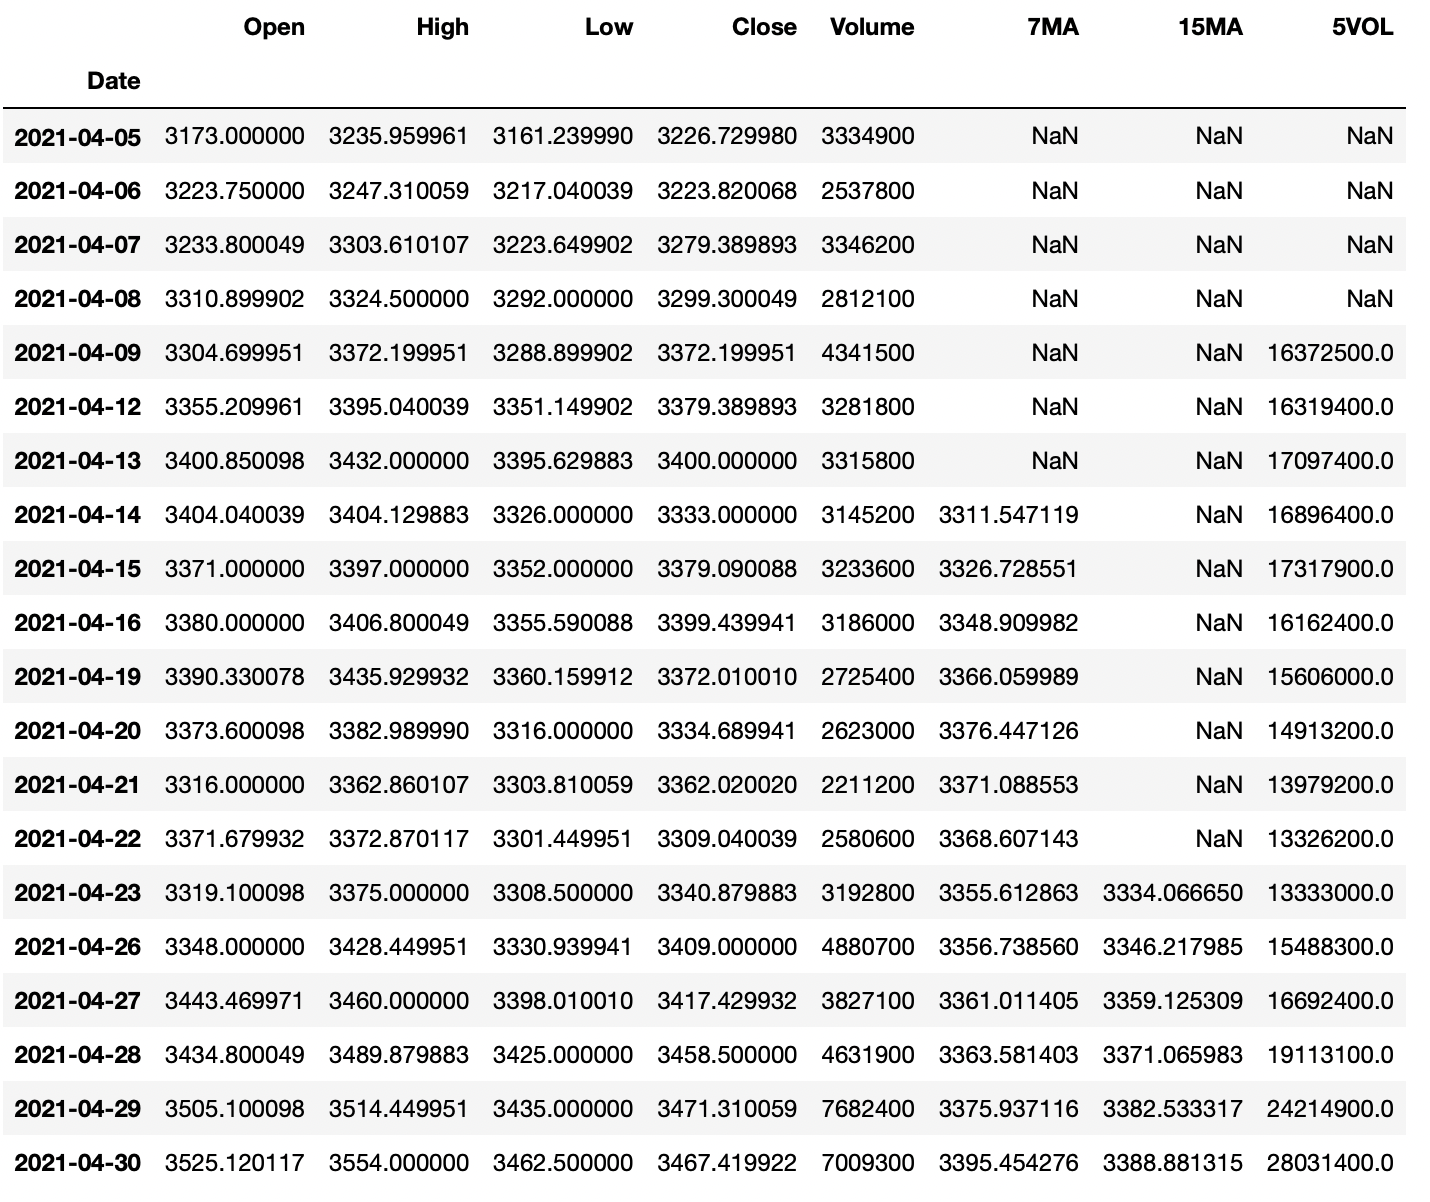
The resulting dataframe contains data about the opening price, the highest price, the lowest price, the closing price, and the trading volume for each day.
Calculating moving averages
The first calculations using the rolling method I will do are some different moving averages values. They are often applied in stock analysis.
 A moving average value is a statistic that captures the average change in a data series over time. (source)
Let’s calculate the moving averages for seven days and 15 days for the stock closing price and add those values as new columns to the existing amazon dataframe.
They are named 'MA7' and 'MA15'.
# Calculating the 7 and 15 day moving averages based on closing price

# and adding them as new columns

AmazonData1y['7MA'] = AmazonData1y['Close'].rolling(7).mean()

AmazonData1y['15MA'] = AmazonData1y['Close'].rolling(15).mean() display(AmazonData1y.head(20))

Since there is no data before 2021-04-01, no seven-day moving average can be calculated before 2021-04-13 and no 15-day moving average before 2021-04-23.
Calculating the Sum of Trading Volume
Let’s now instead use the rolling method to calculate the sum of the volume from the last five trading days to spot if there was any spike in volume.
It is done in the same way as for the moving average, but here the sum() method is used together with the rolling method instead of the mean() method.
I will also add this as a new column to the existing Amazon dataframe.
# Calculating 5 day volume using rolling

AmazonData1y['5VOL'] = AmazonData1y['Volume'].rolling(5).sum() display(AmazonData1y.head(20))
This metric might not be the most useful but it is a good way to explain how you could use the rolling method together with the sum() method.
Using rolling() with Aggregation
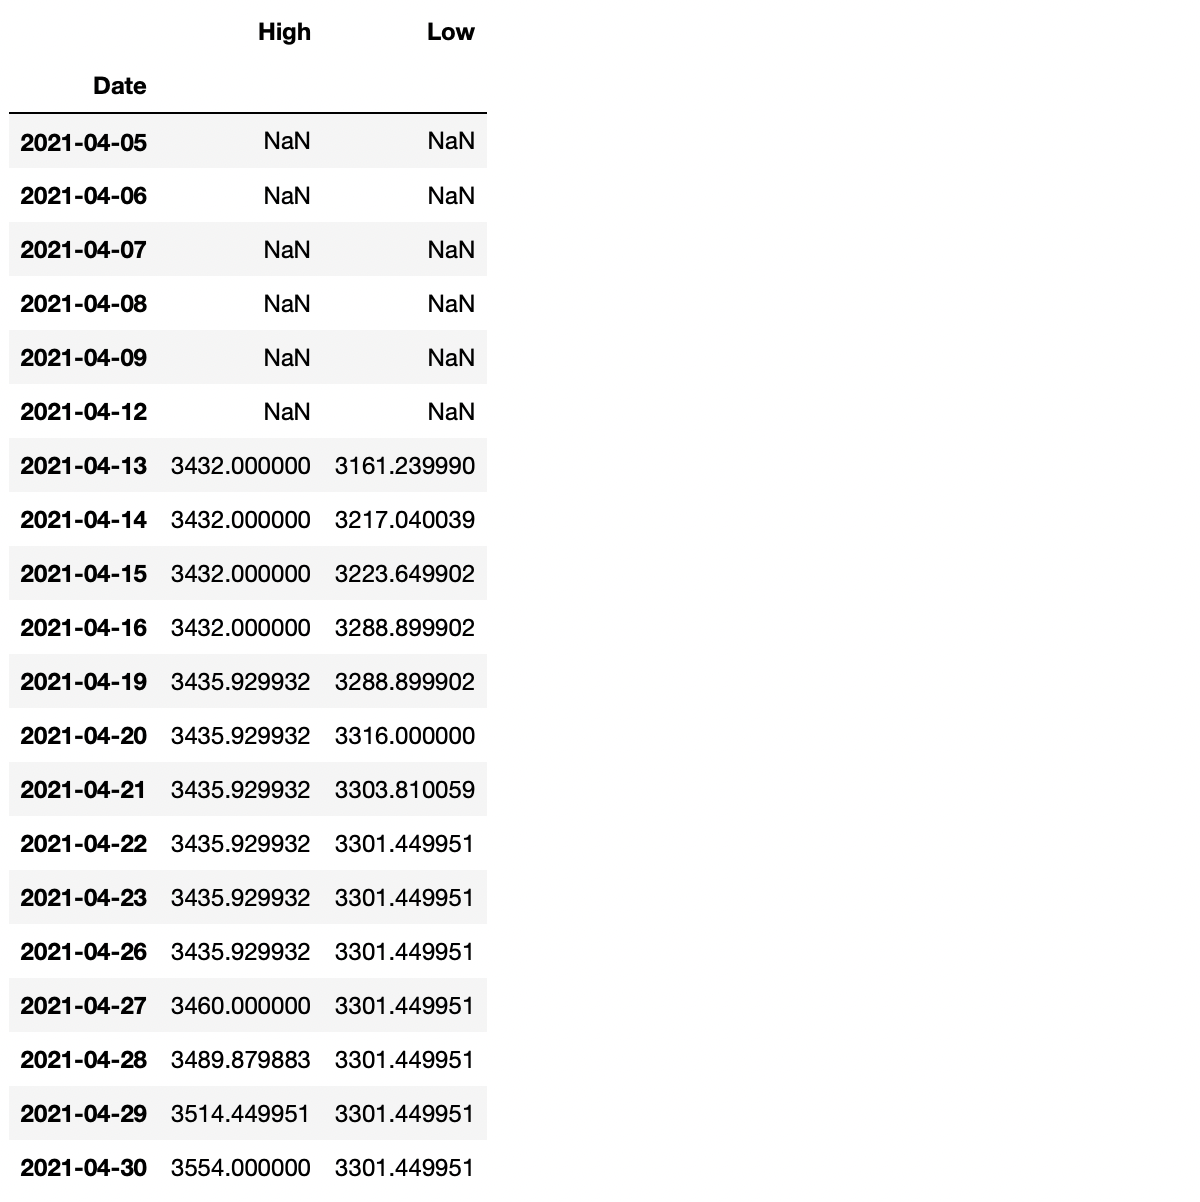
If combining the rolling() method with the aggregation method agg(), it is easy to perform rolling calculations on multiple columns simultaneously.
Say that I would like to find the highest high and the lowest low for the last seven days.
# Performing rolling calculations on multiple columns at the

# same time using .agg()

SevenHighAndLow = AmazonData1y.rolling(7).agg({'High': 'max', 'Low': 'min'}) display(SevenHighAndLow.head(20))
Plotting the Values
This part will be included to visualize the value calculated. It’s a bit more appealing than simply just looking at columns of a dataframe.
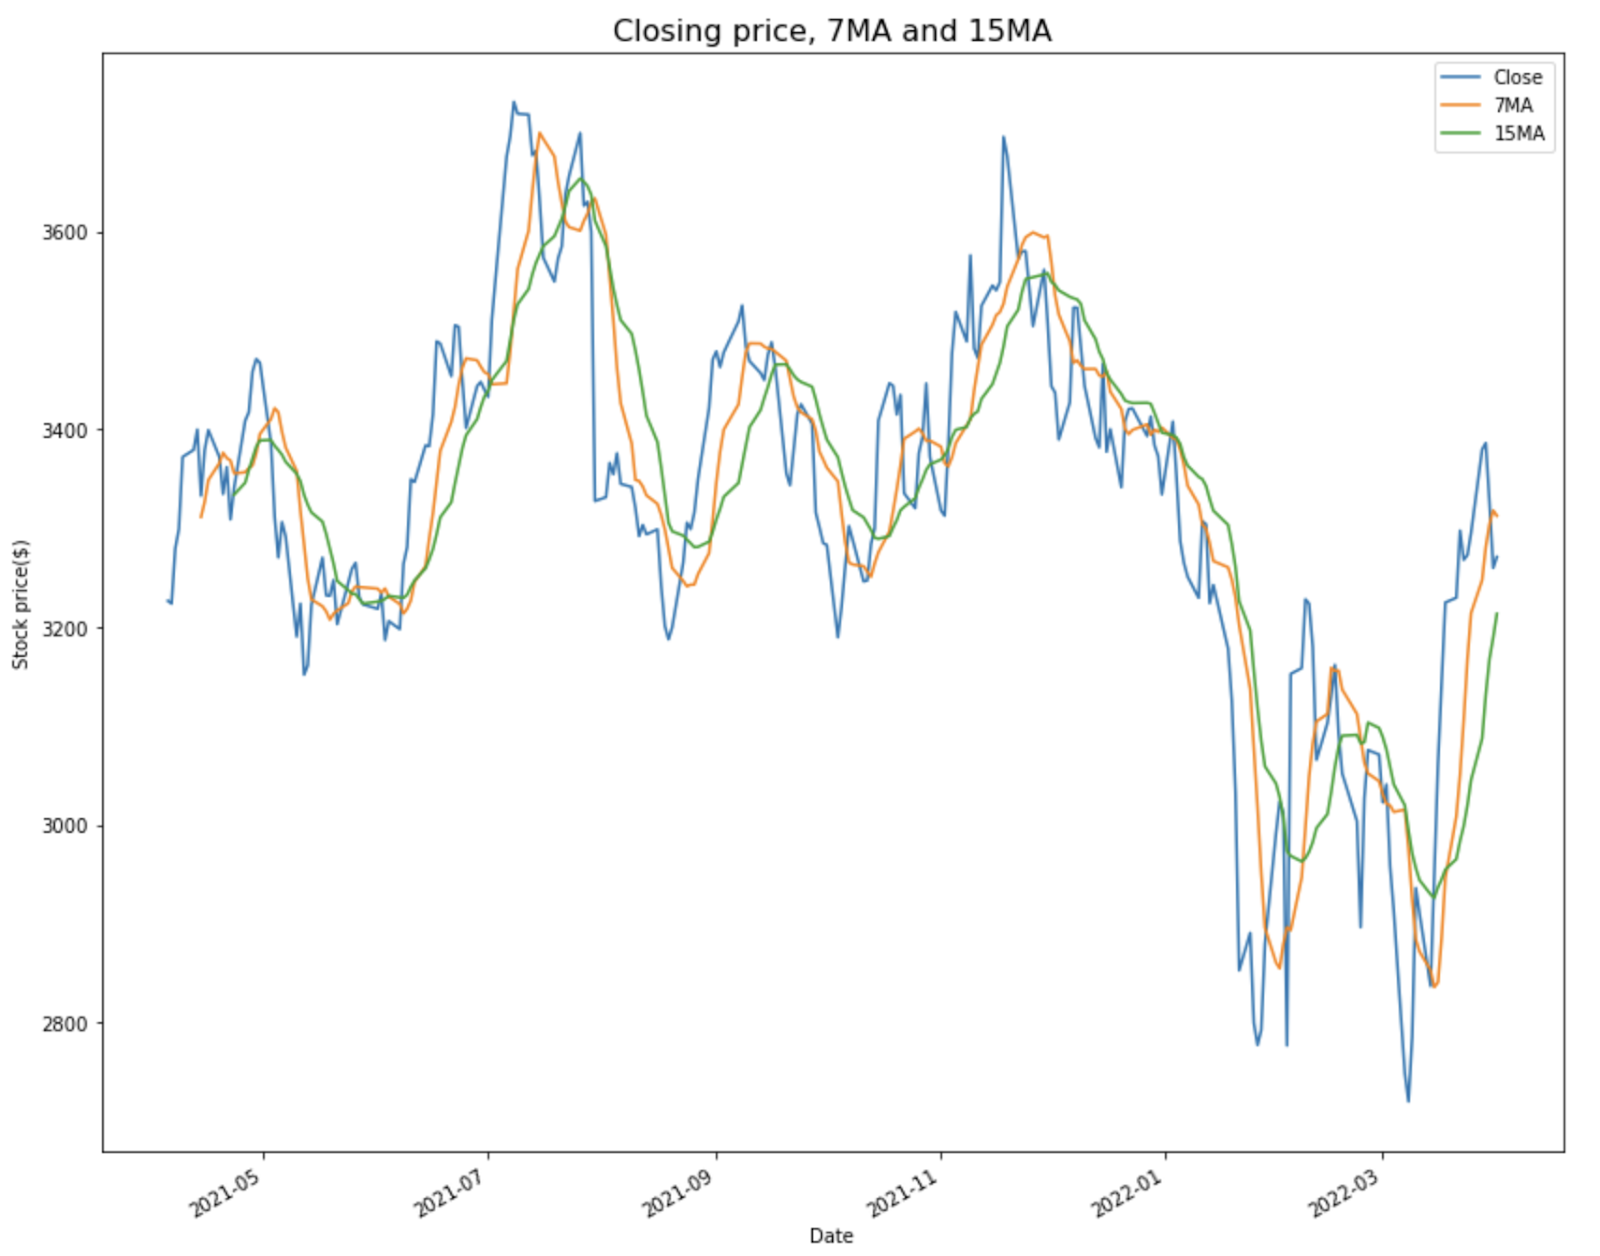
First, let’s plot the calculated moving averages values alongside the closing price.
# Plotting the closing price with the 7 and 15 day moving averages

AmazonData1y.plot(y=['Close', '7MA', '15MA'], kind='line', figsize=(14,12)) plt.title('Closing price, 7MA and 15MA', fontsize=16)

plt.xlabel('Date')

plt.ylabel('Stock price($)')

plt.show()
And then the accumulated 5 day volume alongside the closing price.
# Plotting the closing price alongside the 5 day volume

AmazonData1y.plot(y=['Close', '5VOL'], secondary_y='5VOL', kind='line', ylabel='Stock Price ($)', figsize=(14,12)) plt.title('Closing price and 5 day accumulated volume', fontsize=16)

plt.xlabel('Date')

plt.ylabel('Volume')

plt.show()

Summary
This was a short tutorial on applying the rolling() method on a pandas dataframe using some statistics.
The goal of this article was to demonstrate some simple examples of how the rolling() method works, and I hope that it did accomplish that goal.
The rolling() method can be used for most statistics calculations, so try and explore it using other methods than those used for this article.
https://www.sickgaming.net/blog/2022/04/...ted-guide/