


Artificial neural networks have become a powerful tool providing many benefits in our modern world. They are used to filter out spam, to perform voice recognition, and are even being developed to drive cars, among many other things.
As remarkable as these tools are, they are readily within the grasp of almost anyone. If you have technical interest and have some experience with computer programming you can build your own neural networks.
But before you learn the hands-on details of building neural networks you should learn some of the fundamentals of how they work. This article will cover one of those fundamentals – how neural networks learn.
Note: This article includes some algebra and calculus. If you’re not comfortable with algebra, you should still be able to understand the content from the graphs and descriptions. The calculus is not done in any detail. Again you should still be able to follow along from the descriptions. You will not learn the details of how the calculations are done. Instead, you will gain an intuitive understanding of what is going on.
Before learning this, you should be familiar with the basics of how neural networks are structured and how they operate. The article “The Magic of Neural Networks: History and Concepts” covers these basics. Still, we offer the following brief refresher.
Basic Fundamentals: How Neural Networks Work
Figure 1 shows an artificial neuron.

Signals from other neurons come in through multiple inputs, each multiplied by its corresponding weight (Weights express the connection strengths between the neuron and each of its upstream neurons.).
A bias is input as well (bias expresses a neuron’s inherent activation, independent of its input from other neurons.). All these inputs add together, and the resulting total signal is then processed through the activation function (A sigmoid function is shown here.).
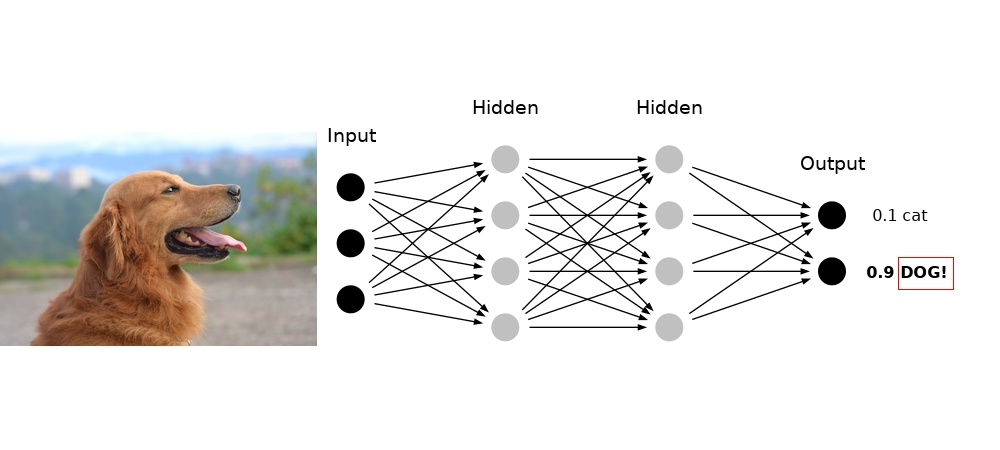
Figure 2 shows a network of these neurons. Signals are introduced on the input side, and they progress through the network, passing through neurons and along their connections, getting processed by the calculations described above. How the signals are processed, depends on the weights and biases among all the neurons.
 The key takeaway is that it is the settings of the weights and biases that establish how the network as a whole computes. In other words, the learning and memory of the network is encoded by the weights and biases.
So how does one program these weights and biases?
They are set by training the network with samples and letting it learn by example. The details of how that is done is the subject of this article.
Overview of How Neural Networks Learn
As mentioned, a neural network’s learning and memory is encoded by the connection weights and biases of the neurons throughout the network.
These weights and biases are set by training the network on examples by following this six-step training procedure:
- Provide a sample to the network.
- Since the network is untrained, it will probably get the wrong answer.
- Compute how far this answer is from the correct answer. This error is known as loss.
- Calculate what changes in the weights and biases will make the loss smaller.
- Make adjustments to those weights and biases as determined by those calculations.
- Repeat this again and again with numerous samples until the network learns to answer the samples correctly.
Presenting Samples and Calculating Loss
Let’s review some of this in more detail while considering a use case.
Imagine we want to train a network to estimate crowd size.
To do this we must first train the network with a large set of images of crowds. For each image the number of people are counted. We then include labels indicating correct crowd size for each picture. This is known as a training set.
The pictures are submitted to the network, which then indicates its crowd estimate for each picture. Since the network is not trained, it surely gets the estimate wrong for each image.
For each image/label pair, the network calculates the loss for that sample.
Multiple possible choices can be used for calculating loss. One can choose any calculation that appropriately expresses how far the network’s answer is from the correct answer.
An appropriate choice for crowd-size loss estimate is the square error:

where:

Suppose we submit an image showing a crowd size of 500 people. Figure 3 shows how the error varies for crowd estimates around the true crowd size of 500 people.

If the Network guesses 350 people the loss is 22500. If the network guesses 600 people the loss is 10000.
Clearly, the loss is minimized when the network guesses the correct crowd size of 500 people.
But recall we said it is the weights and biases in the network that encode its learning and memory, so it is the weights and biases that determine if the network gets the right answer. So we need to adjust the weights and biases so that the network gets closer to the correct answer for this image.
In other words, we need to change the weights and biases to minimize the loss. To do that, we need to figure out how the loss varies when we vary the weights and biases.
Minimizing Loss: Calculus and the Derivative
So how do we calculate how loss changes when we vary weights and biases?
This is where calculus comes in.
(Don’t worry if you don’t know calculus, we’ll show you everything you need to know, and we’ll keep it intuitive.)
Calculus is all about determining how one variable is affected by changes in another variable.
(Strictly speaking there’s more to calculus than that, but this idea is one of the core ideas of calculus.)
The loss L depends on network output y, but y depends on input, and on weights w and biases b. So there is a somewhat long and complicated chain of dependencies we have to go through to figure out how L varies when w and b vary.
However, for the sake of learning, let’s instead start by just examing how L varies when y varies, since this is simpler and will help develop an intuition for calculus.
How L depends on y is somewhat easy – we saw the equation for it earlier, and we saw the graph of that equation in Figure 3. We can tell by looking at the graph that if the network guesses 350 then we need to increase the output y in order to reduce the loss, and that if the network guesses 600 then we need to decrease the output y in order to reduce the loss.
But with neural networks, we never have the luxury of being able to examine the graph of the loss to figure it out.
We can, however, use calculus to get our answer. To do this, we do what is called taking the derivative.
Here is the derivative of the equation for the graph in Figure 3 (note, we will not explain how this is calculated, that is the domain of a calculus course.):

This is typically referred to as “taking the derivative of L with respect to y”. You can read that dL/dy as saying “this is how L changes when y changes”. Now let’s calculate how L changes when y changes at the point y = 350:

So at y = 350, for every bit y increases, L decreases by 300. That implies that when we increase y the loss will decrease.
Now let’s calculate how L changes when y changes at the point y = 600:

So at y = 600, for every bit y increases, L increases by 200. Since we want to decrease L, that means we need to decrease y.
These calculations match what we concluded from looking at the graph.
You can also read dL/dy as saying “this is the slope of the graph”.
This makes sense: at point y = 350 the slope of the graph is -300 (sloping down steeply), while at point y = 600 the slope of the graph is 200 (sloping up, not quite so steeply).
So by using calculus and taking the derivative, we can figure out which way to change y to reduce the loss L, even when we can’t see the graph to figure it out.
Recall, however, that we want to figure out how to change the weights and biases to reduce the loss L. Also recall there is a chain of dependencies, of L depending on y, which itself depends on w and b (for several layers worth of w and b!), and on input.
So a full description could result in some rather complicated equations and some difficult derivatives. For those curious about the math details, the method for figuring out derivatives when there is such dependencies is called the chain rule.
Fortunately, with modern neural network software, the computer takes care of calculating derivatives and keeping track of and resolving the chains of dependencies in the derivatives. Just understand that, even if we can’t see its graph:
- there is some relationship between the loss L and the weights w and biases b (a “graph”)
- there is some set of weights and biases where the loss L is at a minimum for a given input
- we can use calculus to figure out how to adjust the weights and biases to minimize loss
The Loss Surface and Gradient Descent
Let’s consider a very simple case where there are just two weights, w1 and w2, and no biases. The graph of L as a function of w1 and w2 might look like figure 4.

In this example, with two independent weights, we end up with a bowl-shaped surface for the loss graph. In this case, the loss is minimized when w1 = 4 and w2 = 3. In the beginning, when the network is not yet trained the weights (initially set to small random numbers) are almost certainly not at the correct values for the loss to be at a minimum.
We still figure out which direction to change the weights to reduce the loss by taking the derivative.
Only this time, since there are two independent variables, we take the derivative with respect to each independently.
Important: The result is, for any given point on the loss surface, a direction (a vector, or an arrow) pointing in which direction the loss increases the fastest (“uphill”). This is known as the gradient (instead of derivative). Since we want to reduce loss, we move in the opposite direction, the negative of the gradient.
The larger point is we are still using calculus to figure out which direction to change weights to reduce loss. Repeatedly doing this moves the weights closer to the values which make the network give the correct answer for a given input. This is known as gradient descent.
However, most neural networks have many more than two weights, typically dozens for any given layer.
But the same ideas still apply: if we have a layer consisting of 16 weighted connections, the loss is a 16-dimensional surface! You can’t visualize it but it still exists mathematically, and the same principles apply!
You can still calculate the gradient, that is the derivative with respect to all 16 w’s, and figure out which direction to change the w’s to minimize the loss.
So how much do we adjust the weights and biases?
Typically they are adjusted just a small amount. This is because large adjustments can cause problems.
Refer to the loss surface shown in Figure 4. If too large a step is made, you could jump right across the loss surface bowl, even going so far as to make the loss worse!
The adjustment step size is known as the learning rate. Figuring out the best learning rate is one of the tricks to optimizing your network that a neural network engineer has to work out.
Backpropagation
Ultimately all of the weights and biases throughout the network have to be adjusted to minimize loss. This is done back from the loss, working back layer by layer to the beginning of the network, a process called backpropagation.
It has to be done this way because you can’t figure out how the first layer’s weights and biases affect loss until you know how the second layer’s weights and biases affect loss; you can’t tell how the second layer’s weights and biases effect loss until you know how the third layer’s weights and biases effect loss, and so on.
So calculations and adjustments are done starting with the last layer, then working back to the second to the last layer, and so on back to the first layer.
So that’s the core algorithm of training a neural network:
- Present example image.
- Calculate the loss.
- Adjust the network weights and biases through backpropagation, calculating gradient descent, and making adjustments layer by layer.
Batch Size
However, recall that the objective of the training is to adjust the weights and biases for all of the images, not just one.
So how does one train the network, one image at a time, or using the entire set of all training images? Either choice is a possibility.
Ultimately the loss we want to minimize is the loss for the entire set of training samples, so a natural choice might be to run all samples through the network before making adjustments to the weights and biases. This is known as batch processing.
However performing so many calculations before making adjustments can be very demanding on computer resources and can slow the training process down.
How about adjusting weights and biases for each individual training sample? Optimum weights and biases will be different for each training sample, and this variation can introduce large randomness into the gradient descent. This is known as stochastic gradient descent.
To better understand the importance of this refer to the hypothetical loss curve in figure 5:

Notice that there is more than one minimum: there is a local minimum at point B, which is not quite the lowest loss, and a global minimum at point A that is truly the minimum where the loss is lowest.
It is truly possible (even likely) to get loss curves like this, with multiple local minima, and it’s also possible for the network to get stuck in one of these local minima.
The randomness of single sample training can help knock the network out of a local minimum if it gets stuck in one, so there is some benefit to stochastic gradient descent.
However, the randomness can be so extreme that it can actually knock the network out of the true global minimum if it happens to reach it before a training cycle ends. This can slow the training as the network has to work back down to minimize the loss again.
So in practice, it turns out the best approach is to use minibatches. These are batch sizes of perhaps a few hundred samples that are run through the network, and then adjustments are made.
The network runs through mini batch after many batch until the entire set of training samples has been processed. This has enough randomness to it that it has the same benefit as stochastic gradient descent of pushing the network out of local minima, but not so much randomness that the loss can get worse.
Running through the entire set of training samples once is called an epoch.
Typically networks must run through many epochs to become fully trained. Also the ordering and grouping of training samples within and between batches is randomized from epoch to epoch. This is to avoid overfitting.
Overfitting is when the network performs successfully on the training samples, but fails on samples it has not seen before. This is like a person memorizing a set of samples, rather than generalizing characteritics from those samples so that it can be successful on new samples.
After training the network is then tested on a test set. This is a set of samples the network has not seen before. This allows one to assess how well the trained network performs. It checks to see how effective the network is on unknown samples, and checks to make sure overfitting has not occurred.
How Neural Networks Learn
So that is the full process of how neural networks learn:
- Train the network by presenting it minibatches of samples from the training set.
- The training algorithm calculates the loss for the minibatch.
- The algorithm calculates the gradient of the loss.
- The network adjusts weights and biases according to the gradient calculations, through the process of backpropagation and gradient descent.
- Running this sequence through all training samples is called an epoch.
- This is then repeated for multiple epochs, until the network is successfully trained on the training set.
- Finally the network is tested on a test set to make sure it works successfully and does not suffer from overfitting.
We hope you have found this lesson on how neural networks learn informative.
We wish you happy coding!
https://www.sickgaming.net/blog/2022/08/...rks-learn/