B.I.O.T.A. is a 2D metroidvania action-platformer, in which you command a team of mercenaries and investigate a mining colony infected by an alien plague.
Explore a pixel art world packed with mutant monsters and deadly traps. Try to survive using a multitude of guns and various crafts, including a mech, a sub, and a starship.
JDK 13.0.1, 11.0.5, 8u231, and 7u241 Have Been Released!
The JDK 13.0.1, 11.0.5, 8u231, and 7u241 update releases are now available. You can download the latest JDK releases from the Java SE Downloads page. OpenJDK 13.0.1 is available on http://jdk.java.net/13/. An item of interest in the CPU release is that JDK 8u231 also includes JDK 8u231 for ARM. Info...
Posted by: xSicKxBot - 05-01-2022, 01:09 AM - Forum: Python
- No Replies
Python Base64 – String Encoding and Decoding [+Video]
A Short Guide to Base64’s History and Purpose
Base64 is a system of binary-to-text transcoding schemas, which enable the bidirectional transformation of various binary and non-binary content to plain text and back.
Compared to binary content, storage and transfer of textual content over the network is significantly simplified and opens many possibilities for flexible data exchange and processing between different, heterogeneous information systems.
One of the key benefits of Base64 is the possibility of data transfer over e-mail attachments.
Why is this important?
Well, as e-mail is one of the oldest and most used communication technologies, dating back to 1971, it is a very common way of conveying information between a sender and any number of receivers. The information is most often delivered as a readable text message, but it can also carry an attachment in a binary form.
E-mail servers and clients support transfers of attached binary content by converting it to plain text before sending and back to the original binary content after receiving.
Of course, there is some overhead in terms of time needed for conversion of the content, but it lends to the flexibility of unrestricted content exchange.
Some other uses of Base64 are the storage of binary content in information systems, such as databases.
Base64 should not be mistaken for a cryptographic algorithm, because it does not encrypt the data. It just converts the data to plain text and the transcoding schema is very well known, so there is no secrecy involved.
Base64 Memory Addressing Schema
Before we move on, I’d like to share a couple of thoughts on memory addressing schema.
When a computer stores and handles the data in its memory, namely the Random Access Memory (RAM), it has to use an addressing scheme.
In a common computer architecture model, the memory locations are accessed by their addresses.
Although it is not the only approach, we will take a look at how the byte addressing scheme works because it is the best approximation for our explanation of the Base64 mechanism.
When a memory location is addressed, a specific amount of data, i.e. 1 byte (equals to eight bits) is read from it. This one byte is used as the smallest addressable amount of data available.
If in some imaginary case we would have to store less than one byte of data, let’s say, only three bits, such as 101, that data would get padded with zeroes and would look like 0000 0101 (don’t mind the space, it is here just to make the example more readable).
In a described case, we say that the addressing scheme used is byte-addressing.
In some other cases, where the addressing scheme would use more than one byte (but always the multiple), like four bytes (32 bits = 1 word), each data shorter than 4 bytes would get padded to the full length of 4 bytes.
Accordingly, if the data we are handing is longer than four bytes, it would get split between more than one memory location by the formula: ceil(data_len / mem_loc_len), where
ceil() is a mathematical function for up-rounding to the nearest higher integer,
date_len is the length of our data in bits (bytes) and
mem_loc_len is the length of our memory location in bits (bytes).
In other words, if our data is 33 bits long and our memory location is 32 bits long, our data would occupy two memory locations because ceil(33/32) = 2.
Base64 Transcoding Table
Base64 schema uses 64 characters (hence the name), which can be encoded with only six bits, since 2^6 = 64.
Before we go more specific about the transcoding mechanism, we should construct our transcoding table of symbols. The standard way of doing so is defined by RFC 4648, which says that the transcoding table
starts with capital letters of the English alphabet A-Z,
followed by small letters of the English alphabet a-z,
followed by digits 0-9, and
is concluded by symbols + and /.
The padding symbol, not included in the table is the equality sign =.
Base64 Transcoding Mechanism
The transcoding mechanism for binaries takes into account that our data exists in byte-sized segments, meaning that whatever data we take and split into segments of 8-bit size, every segment will be full by design (because of the memory addressing schema), without the need to do any padding.
From this point on, we will consider our data on the bit level.
The process is very simple: we take three byte-sized segments and consider them as a segment of 3 x 8 bits = 24 bits.
This choice of length will be further discussed in our section on “The Least Common Multiple” below.
Our segment of 24 bits is further segmented into four 6-bit segments, which will represent our keys for the transcoding table. Each of the four keys gets transcoded to the associated symbol, i.e. one of the 64 available symbols in the transcoding table.
For instance, if our 6-bit segment is 000 111, it gets transcoded to symbol 'H', and a segment 111 000 gets transcoded to symbol '4'.
Base64 Special Considerations
When there is a case where our ending data segment length does not correspond to three bytes, but two bytes or a one-byte segment instead, we have to take into account special considerations, and this is where we introduce bit padding.
First, let us discuss how to process the two-byte segment.
A two-byte segment consists of 16 bits that get split into two whole 6-bit segments (2 x 6 bit = 12 bit) and a rest of 4 bits. These four bits are padded with two 0 bits that will complete the segment to a 6-bit length.
However, now that we have three 6-bit segments, and four segments were originally needed, the transcoding mechanism will take note of that and introduce a special, character-level padding symbol to account for the last segment.
This symbol does not exist in the transcoding table and is denoted as '='.
Here is an example of such a case: the original 2-byte data segment 0011 0101 0010 1010 gets split into 001 101 010 010 101 0+00 where bits 00 are used as segment-level padding to ensure us having three full segments.
These segments are transcoded to symbols 'NSo' and the symbol '=' is added to account for the missing 6-bit segment, resulting in 'NSo='.
Considering the given example, we can always tell that if there is only one symbol '=' in the end, two bits were added to the original data and will be removed when we transcode the Base64 string back to the original data.
In the second possible example, our original data is made up of only one byte. This byte will get split into one 6-bit segment and the remaining two bits are padded with four 0 bits that will complete the segment to a full 6-bit length.
Now that we have two 6-bit segments, and four segments were originally needed, the special symbol will be used two times to account for the missing segments: '=='.
Here is an example of such a case: the original 1-byte data segment 0011 0101 gets split into 001 101 01+0 000 where bits 0 000 are used as segment-level padding to ensure us having two full segments. These segments are transcoded to symbols 'NQ' and two padding symbols '==' are added to account for the two missing 6-bit segments, resulting in 'NQ=='.
Considering the given example, we can always tell that if there are two symbols '=' in the end, four bits were added to the original data and will be removed when we transcode the Base64 string back to the original data.
Base64 Encoder/Decoder Implementation in Python
A Python implementation of a Base64 encoder/decoder is presented below. Presumably less intuitive parts are commented on for better understanding and convenience.
class Base64(object): CHARS = 'ABCDEFGHIJKLMNOPQRSTUVWXYZabcdefghijklmnopqrstuvwxyz0123456789+/' # 1-byte padding symbol. padding_symbol = b'\x00' @classmethod def chunk(cls, data, length): # Creates an array of data chunks (segments). data_chunks = [data[i:i + length] for i in range(0, len(data), length)] return data_chunks # Encodes the string to a Base64 string. @classmethod def encode(cls, data): padding_length = 0 # Calculates the length of the padding. if len(data) % 3 != 0: padding_length = (3 - len(data) % 3) % 3 data += cls.padding_symbol * padding_length # Splits the data in three-byte chunks. chunks_3_byte = cls.chunk(data, 3) # Generates a binary string representation of each byte in the chunk, # i.e. three bytes -> three binary representations per chunk. bin_string_repr = "" for chunk in chunks_3_byte: for byte in chunk: # Cuts off the '0b' string prefix and appends # to the 'bin_string_repr'. # {:0>8} stands for leading zeroes, align right, 8 places. bin_string_repr += "{:0>8}".format(bin(byte)[2:]) # Splits the data in six-bit chunks. chunks_6_bit = cls.chunk(bin_string_repr, 6) base64_encoded_str = "" for element in chunks_6_bit: # Transcodes the binary representation (2) string to an integer, # and maps it to an alphanumeric string. base64_encoded_str += cls.CHARS[int(element, 2)] # Encodes the ending with the padding character(s) '='. base64_encoded_str = base64_encoded_str[:-padding_length] + '=' * padding_length return base64_encoded_str @classmethod def decode(cls, data): # Counts the number of '=' occurrences; this way we'll know # how much of the padding we should trim (0, 1 or 2 chars). replaced = data.count('=') # Replaces '=' by 'A'; it will be trimmed at the end, but we # need it until then to retain 3-byte segments. data = data.replace('=', 'A') binstring = '' # Processes each character and returns its binary code. for char in data: # {:0>6b} stands for leading zeroes, align right, 6 places, binary. binstring += "{:0>6b}".format(cls.CHARS.index(char)) # Splits the data in 1-byte (8-bit) chunks. chunks_1_byte = cls.chunk(binstring, 8) base64_decoded_str = b'' for chunk in chunks_1_byte: # Creates the decoded byte-string. base64_decoded_str += bytes([int(chunk, 2)]) return base64_decoded_str[:-replaced] if __name__ == "__main__": b64_enc = Base64.encode(b'Finxter rules!') print(b64_enc) b64_dec = Base64.decode(b64_enc) print(b64_dec)
The Least Common Multiple
You might have asked yourself, why are we taking exactly 24 bits as a segment for transcoding to Base64?
There is a very simple reason behind this step, and it is called “the least common multiple”, also denoted shortly as “LSM”.
Least Common Multiple (LSM): Given any two numbers A and B, the least common multiple of A and B is the smallest number that is divisible by both A and B without remainders. For instance, the least common multiple of 2 and 3 is 6, because 6 / 2 = 3 with remainder = 0, and 6 / 3 = 2 with remainder = 0.
In the case of our specific interest, numbers A and B represent the length of segments in our addressing schema (8 bits) and the length of a binary represented character in the Base64 transcoding table (6 bits -> 64 characters).
By calculating the least common multiple for 6 and 8, we get 24.
If we perform a validity check: 24 / 6 = 4 with remainder = 0, 24 / 8 = 3 with remainder = 0, we can confirm that 24 indeed is a length that should be used for segment generation to support both 6-bit and 8-bit segments.
Conclusion
In this article, we learned about the Base64 transcoding mechanism.
First, we explained the use of Base64 in a real-world context.
Second, we touched upon the topic of memory addressing schema.
Third, we got acquainted with the transcoding table.
Fourth, we explained how the transcoding mechanism works.
Fifth, we dove into special considerations on how to handle “incomplete” data (incomplete in terms of not being a 24-bit multiple).
Sixth, we analyzed a Base64 implementation.
Seventh, we held our breath for some simple math theory on the least common multiple.
[freebies.indiegala.com] Are you ready to prove that your reaction is outstanding, shunting between sharp barriers & collecting bonuses? Remember: the light of victory awaits.
As the only one left with full senses, you embark on a journey in search of answers and relief in this FPS game that is created in a distinctive retro horror comic book style and feels as if it came straight out of Lovecraft's books.
Be aware of your madness level which dynamically changes during gameplay and gives you additional power. Choose your active skills depending on your play style and use them to fight against the eternal evil.
Explore this Lovecraft-inspired world that is full of hidden and hard to reach areas, and uncover the entire story to solve the mystery of this crazy place.
Streamlit is an easy-to-use rapid web application development platform. It can create compelling data visualizations using python.
Line charts are one of the many types of charts that Streamlit can display. Line charts are often a great visual for displaying numerical data over time.
This tutorial will teach you how to easily create and configure line charts in Streamlit with the Altair Chart library.
Below is a vivid line chart graph that you can create with Altair Charts:
This tutorial will teach you how to make line charts by walking you through the creation and the altering of simple line charts. It will then show you how a more sophisticated multi-line chart like the one above.
The source code for the tutorial is here on Github.
The following imports will need to be made to follow along with the tutorial
The first step you need to do is to create or import a data frame.
To create a line chart there must be one or more number types or one ordinal, which is an ordered type like a date.
Below is a simple example data frame called energy_source. It’ll be used through the next couple of customizations of the chart with the text you’ll need to import. You can see the energy source data frame was created below. This energy source data frame will be used throughout the tutorial.
The data frame then gets passed to the alt.Chart() class that creates the chart object. Now the charts can be extended to different types of graphs.
The mark_line() function is what creates the chart that reflects the data frame that was passed into the function.
Next, call the encode() function and specify the y-axis and the x-axis. They must be specified for the line chart to be created. Also, the y-axis and the x-axis have to be named as columns in the data frame to work. Finally, the y-axis must be a number and the x-axis must be an ordinal, which is a discrete ordered quantity, on the y-axis like a date.
Here’s the visualization created by the above code:
Change the Chart Title and Chart Size with Properties
The chart title and the chart size can be changed by passing in arguments to the properties function.
These get changed with the properties() function by passing in the title. The width and height get passed in to change the overall chart size.
To change the chart title you can chain the configure_title() function to the end of encode() or a configuration function like properties() in the below example.
You can see the visual of the code created below with the title ‘Energy Bill’:
Change the x-Axis and y-Axis Labels
The numerical data the Price ($) is on the y-axis and the non-numerical month (Date) or ordinal (which is a discrete ordered quantity) is on the x-axis.
The default value is the column name. If you want to change the default labels then add the title parameter to the alt function.
In the below example you can see that there is an alt.Y() for the y axis and an alt.X() for the x-axis parameter that gets a title passed as an option to the encode() function.
The chart titles are changed from ‘Price ($)’ and ‘month(Date)’ to the title of ‘Close Price($)’ and ‘Month’. The axis title size can be changed by configuring the access with that which can be changed to the encode() function and other configuration functions such as properties
Below is what the code looks like to change the axis labels and the visual it creates:
Now that you see the basics of how to create a line chart let’s create a visually-rich chart that adds multiple lines to the chart and creates a custom legend. This chart could be used in a demo or as an end project for a client.
Add Multiple Lines to the Chart and Change Legend Text
Multiple lines on a line chart can be great for the comparison of different categories of data over the same time period and on the same numerical scale.
Multiple lines can be added to the chart by making the data frame have multiple category variables in one column that are then passed into the color() function.
The first step is to get a data frame. This is done in the below code by getting get_stock_df. This gets one data frame from a data.DataReader class that contains stock information. The stock symbol determines what stock information the data source gets from yahoo and the start and the end date are what get the data back from.
The second is get_stock_combined(). The get_stock combined combines all the stocks into one data frame. In this different stock symbols of ULT, LIT, USO, and UNG are categories of the below stocks. These different stock categories in the symbol['SymbolFullName'] passed in the line chart are what are used to create multiple lines in the line chart. The name of the stocks being passed in the color function is what is used to create a legend.
The final step is to create the line chart. The line chart is created by using all the steps above. The line variable being passed into streamlit is what creates the chart.
import streamlit as st

import pandas as pd

import altair as alt

from pandas_datareader import data def get_stock_df(symbol,start,end): source = 'yahoo' df = data.DataReader( symbol, start=start, end=end, data_source=source ) return df def get_stock_combined(symbols,start,end): dfs = [] for symbol in symbols.keys(): df = get_stock_df(symbol,start,end) df['Symbol'] = symbol df['SymbolFullName'] = symbols[symbol] dfs.append(df) df_combined = pd.concat(dfs, axis=0) df_combined['date'] = df_combined.index.values return df_combined def get_stock_title(stocks): title = "" idx = 0 for i in stocks.keys(): title = title + stocks[i] if idx < len(stocks.keys()) - 1: title = title + " & " idx = idx + 1 return title stocks = {"LIT":"Lithium","USO":"United States Oil ETF","UNG":"Natural Gas Fund","USL":"US 12 Month Natural Gas Fund (UNL)"} stock_title = get_stock_title(stocks) start = '2021-06-01' end = '2022-08-01' df_combined = get_stock_combined(stocks,start,end) line = alt.Chart(df_combined).mark_line().encode( alt.X("date", title="Date"), alt.Y("Close", title="Closing Price", scale=alt.Scale(zero=False)), color='SymbolFullName' ).properties( height=400, width=650, title=stock_title ).configure_title( fontSize=16 ).configure_axis( titleFontSize=14, labelFontSize=12 ) line
Below is the chart that gets created:
Deploy the Chart to Streamlit.io
Now that you’ve got a seen how to make a line chart. Let’s rapidly deploy it on streamlit.io so it can be shared with others. Streamlit and the Github CLI make the rapid creation of a Streamlit app easy to do.
Streamlit requires a GitHub repository. First, install the Github CLI. Then run the below command.
gh repo create
In the gh repo create step choose git repo to create from an existing repository and choose the configuration you want.
Now type the rest of the commands that add, commit, and push the code to see what you’ve created.
git add .

git commit -m "add file"

git push
Finally, add the repository that you’ve created in Streamlit. When you navigate to the app you’ll see the chart you created in a web application.
Go here
Then select it and click on deploy.
Conclusion
These pieces of demo code should give you a good idea of how to alter the basic functions of the charts.
The last chart is an implementation of the features in the tutorial as well as showing the user how to add multiple lines to a chart and add a chart legend.
The last chart should demonstrate how adding multiple lines to the chart and implementing the above features such as adding a legend, changing the names on the x-axis and the y-axis, and changing the font size. As you can see from this demo adding all these components can create a visually compelling chart!
JDK 13 is live! Download it from the Java SE Downloads page. See the JDK 13 Release Notes for detailed information about this release. The following are some of the important additions and updates in Java SE 13 and JDK 13: Application class-data sharing (ApsCDS) has been extended to allow dynamic ar...
Available until May 2nd. !addlicense asf s/712199 for ASF users.
We are welcoming everyone to join our discord[discord.gg]. We are more active there on finding giveaways, small or large, and there are daily raffles you can participate.
[freebies.indiegala.com] Create your own epic saga of survival, mythology and diplomacy! A unique mix of RPG & strategy: everything in KoDP is about choice and control.
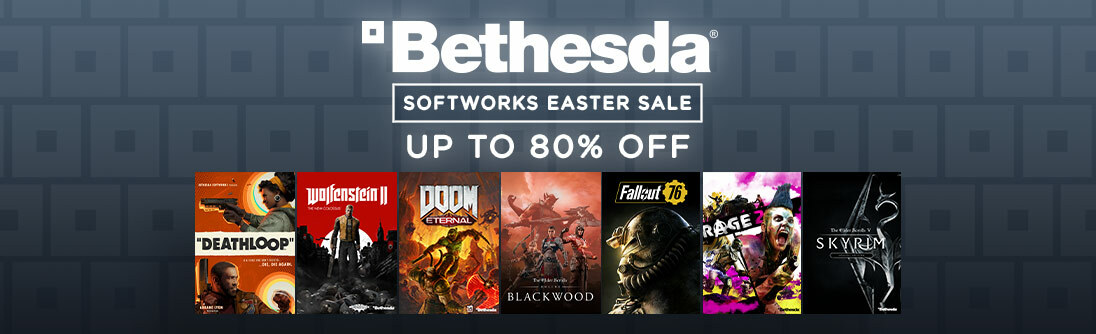
Bethesda Softworks & IO Interactive Easter Sales
[www.indiegala.com] [www.indiegala.com] Happy Easter! Be on the look-out for some huge discounts on your favorite games + a Scratch Card containing a BONUS secret Steam game for every store purchase.
KartRider Rush+ Adds Sonic The Hedgehog In Limited-Time Event
Nexon and Sega have announced a collaboration in KartRider Rush+, a free-to-play kart racing game for mobile devices, that will see Sega icon Sonic the Hedgehog join the game from now until June 30.
Sonic will team up with KartRider's heroes Dao and Bazzi in a quest to collect as many shards as possible, which can then be exchanged for in-game items. Sonic-themed daily quests will also be available during the event, and completing them will earn players the Blue Blur as a permanent character in the game.



 Well, as e-mail is one of the oldest and most used communication technologies, dating back to 1971, it is a very common way of conveying information between a sender and any number of receivers. The information is most often delivered as a readable text message, but it can also carry an attachment in a binary form.
  This choice of length will be further discussed in our section on “The Least Common Multiple” below.